Monitoring the macroeconomic impact of Covid-2019 in real-time: insights from unconventional data
-
-
-
-
M. Pinchetti
"
PhilosophyEconomics is written in this grand book - the universe - which stands continually open to our gaze."
How big is the economic impact of Covid-19 on the economy? This question has been giving economists and policymakers a massive headache for some weeks now.
During the recent crisis, policymakers found themselves to be taking decisions about economic stimulus packages without having a precise idea of the dimension of the contraction in economic activity caused by the coronavirus. Take the case of the US, for instance. The CARES Act, a major piece of legislation aimed at stimulating economic activity, was introduced to Congress on January 24th and ultimately signed into law on March 27th. Nevertheless, up to April 17th, Federal Reserve estimates suggested the US economy was experiencing only a moderate contraction of -0.4%. A similar case could be made for each of the European Union member states.
It goes without saying that having a preliminary assessment of the economic impact of the virus in real time is crucial in order to accurately design effective stimulus packages. This necessity, nevertheless, clashes with the scarcity of proxies of economic activity available in real time. In this article, we explore the potential of some unconventional data to monitor the state of economic activity before official data are released.

Conventionally, real time evaluation of economic activity is performed via a class of models which go under the name of nowcasting models. These models, which were developed inter alia thanks to the contribution of some former ULB scholars in the 2000s,1 are based on the idea that there is a number of common shocks which affect the economy at several layers. Such models are able to exploit the data flow in real time to produce timely forecasts of economic activity in real-time.
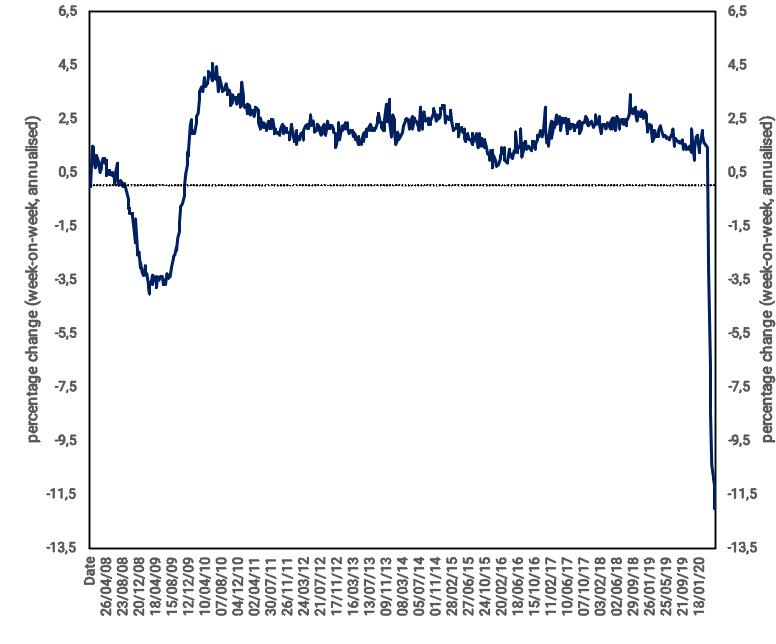
As a concrete example, consider what these researchers at the Federal Reserve are doing here. What you find below is an indicator of weekly economic activity developed by Daniel Lewis, Karel Mertens, and Jim Stock at the Fed to track the status of the economy in real time. What these researchers at the Federal Reserve did is very simple. They used weekly data on steel production, fuel consumption expenditure, electricity consumption, consumer surveys, staffing indices, and unemployment claims in order to construct a weekly index of economic activity. On May 12th, the US weekly economic index says the US economic is shrinking at the rate of -11.2%.
Unfortunately, in Europe, we do not have the same data at a weekly frequency. There are, however, some indicators which allow us to evaluate the state of economic activity in real-time.
In this article we are going to analyse three indicators which will give us a sense of the level of economic activity in real-time in the EU: (i) electricity data, (ii) flight departures, and (iii) mobility indicators.
1) Electricity Data
Since 2015, ENTSO-E, the European Network of Transmission System Operators, publishes the daily electricity consumption for all European countries. Preliminary evidence suggests the electricity consumption to be a strong predictor of the level of economic activity in EU countries. In particular, the year-on-year change in Industrial Production in March 2020 can explain up to the 35% of the year-on-year change in the temperature-adjusted Electricity Consumption at a cross-country level.
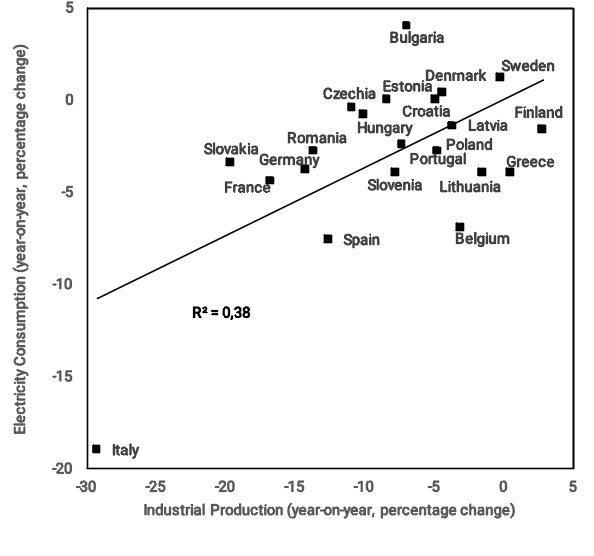
Our preliminary estimates suggests that the year-on-year changes in industrial production in March 2020 covaried almost one-to-one with the year-on-year change in electricity consumption. During the month of March 2020, the temperature-adjusted electricity consumption in Belgium declined by 6.9% whereas industrial production declined by 5.5 % compared to February 2020, and by 3% compared to March 2019. Bruegel provided a detailed documentation of the electricity fallout in the bulk of European and non-European countries here and here.
Electricity demand is typically determined by a household and an industrial component. The household demand, once adjusted for the temperature fluctuations and long-run trends, can be considered acyclical (i.e. not subject to business cycle fluctuations). On the other hand, the industrial demand for electricity is highly dependent on the level of economic activity.
Industrial demand for electricity essentially depends on three factors. The first is the sectorial composition of the economy. For instance, an economy characterised by heavy industrial sectors will have a sizable demand for electricity, whereas a service-based economy will have a much lower demand. The second factor is the energy efficiency of the economy, which measures, ceteris paribus, how much energy is needed in order to produce a certain variety of goods. The last one is the level of economic activity. The industrial sector will employ an amount of electricity proportionate to the volume of the national production.
Therefore, if the first two factors are stable, the drop in electricity can contain precious information concerning the level of economic activity in the economy. Nevertheless, the asymmetric sectorial impact of the Covid shock might represent a confounding factor in the analysis.
2) Flight Departures
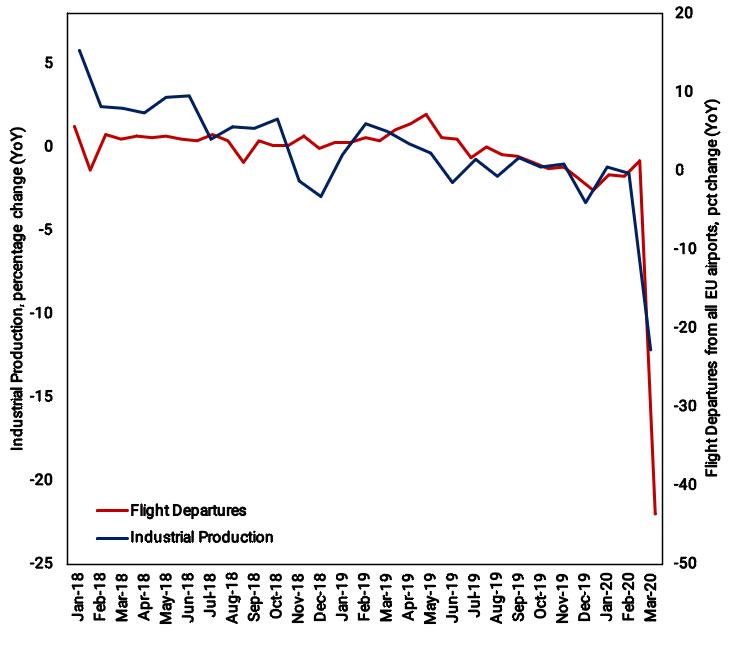
It looks like some sectors are not having an easy time. Take airlines for instance. In March 2020, departures from EU airports plummeted by over 40% compared to March 2019. The drop in the flight departures is correlated with the Industrial Production Index and can explain up to the 47% of its variance. Daily departures and arrivals data are made available at daily frequency by Eurocontrol for all EU countries.
The aviation sector, despite being a relatively small sector - it contributes to the 2.1% of the European GDP - gives a key indication about the mobility of goods and people. This statistics includes commercial air transport services, and general aviation. This indicator, therefore, contains joint information on the flows of commercial goods and passengers for touristic and business reasons. Nevertheless, the correlation between these two variables, might be considerably influenced by the latest data points, and should be handled with care.
While Eurocontrol statistics come with some lag, FlightRadar24 publishes every day the number of planes flying in the world. According to their estimates, the global number of flights declined by 62% in March. Their impressive infographics are definitely worth a click.
3) Mobility Indicators
Google, CityMapper, and Here have developed daily indicators to track the degree of mobility of the urban population. Such indices are useful to get a sense of the degree of dynamism of the population.
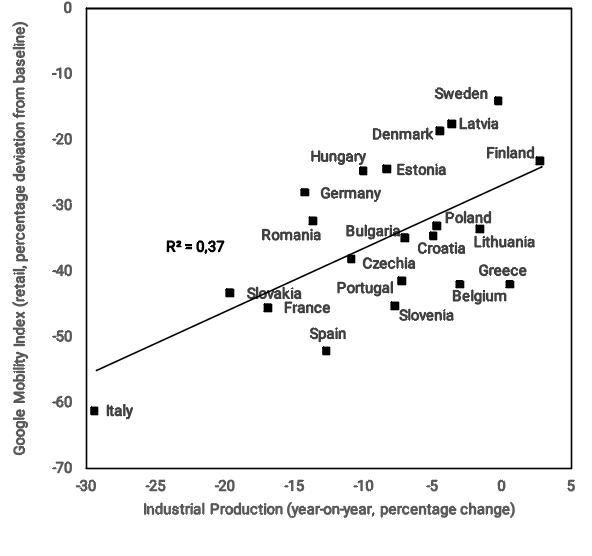
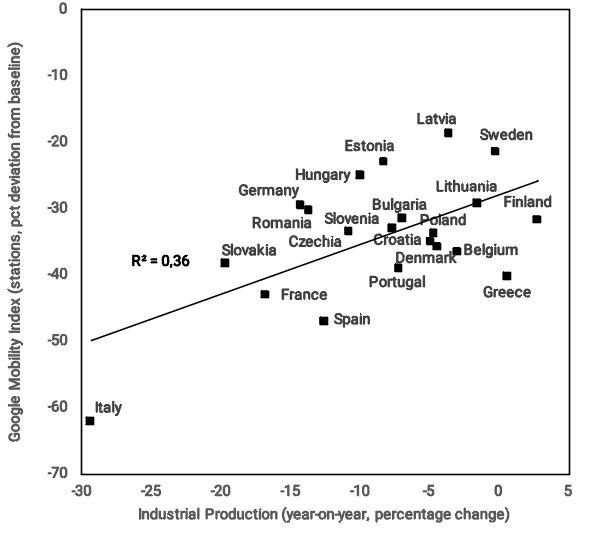
Some preliminary evidence suggests that some of these mobility indices might be useful to keep track of the drop in economic activity. In the figure below, we plot on the y-axis, the year-on-year percentage change in Industrial Production in March 2020, and on the x-axis the average drop in Retail&Grocery mobility and the average drop in the Transit via Stations in March 2020 compared to the average mobility in the previous year. Such indices can account for respectively 36% and the 37% of the variance of the drop in Industrial Production in March 2020 at a cross-country level.
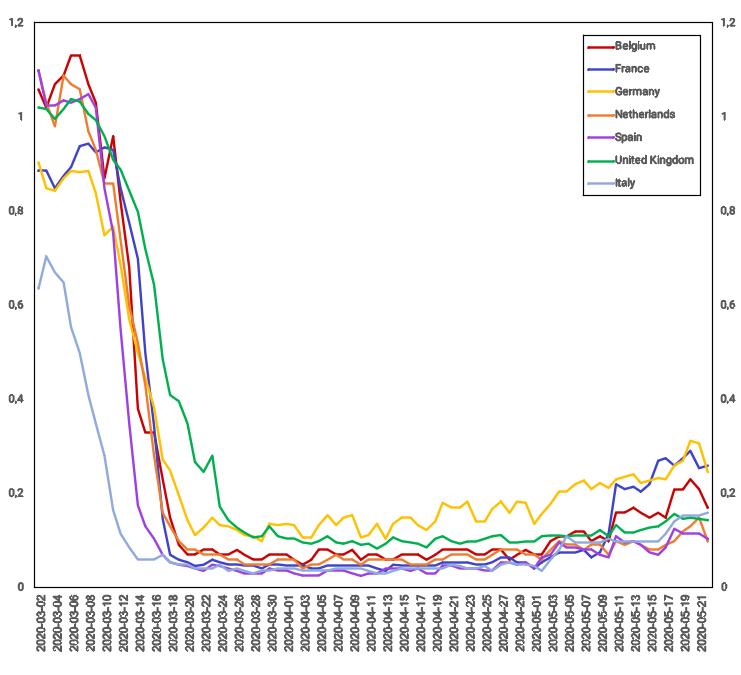
Such correlation might suggest that the drop in the time spent in retail and grocery shops might be a reasonable proxy for the drop in the purchase transactions for consumption goods, whereas the drop in the average transit via stations might contain some information regarding the drop in active employment. The Transit via Station indicator might be more relevant for urban contexts, in which citizens tend to move prevalently via public transports, whereas it might be less informative for extra-urban areas. Real-time urban mobility data from CityMapper suggest that countries like France and Germany might be ahead in the recovery compared to the other EU countries.
Some good reads on the macroeconomic impact of Covid-19:
Vasco Carvalho et al. look at the drop in Spanish consumption through the lens of 1.4 billion transactions.
Sinem Hacioglu, Diego Kanzig, and Paolo Surico estimate that Covid implied a 30% contraction in the median income in the UK using granular transaction data.
Petr Sedlacek and Vincent Sterk argue that if the Covid crisis affects start-up creation (as it is likely), it will have a protracted effect on the economy’s growth rate.
Here the Financial Times collected data from restaurants, cinemas, shops, roads, flights and energy in order to illustrate the slowdown in global economic activity in real time in the UK.
Ravenpack publishes on a daily basis a series of indicators to track the sentiment of the media and the general public.
-
See: Giannone, Domenico & Reichlin, Lucrezia & Small, David, 2008. “Nowcasting: The real-time informational content of macroeconomic data,” Journal of Monetary Economics, Elsevier, vol. 55(4), pages 665-676, May. ↩