The Return on Investment of curbing the COVID-19 pandemic
-
-
-
-
J. Bughin
Dr Jacques Bughin, UN consultant, Solvay Business School ULB, Portulans Institute and G20Y, former Director McKinsey Global Institute, and senior partner McKinsey & Company.
- Introduction
- The macroeconomic burden of influenza pandemics
- Total GDP effects
- Calibrating to Covid-19 – back to last economic crisis?
- The Return to controlling Covid-19 diffusion
1. Introduction
March 4
My two recent articles (available here) have tried to make the case that
- The Covid-19 outbreak might be serious. The Covid-19 looks like it behaves as a global hitter, – not a serial killer like the 1918 Spanish influenza pandemics that killed tens of millions of people, but likely a bug that is an order of magnitude, - more than ten times -, what we know from the flu.
- There is a plausible scenario for reducing its risk, but a way to curb it to level of a severe flu will require a significant set of actions at scale, delivered with speed and agility, and with cooperation to population.
The typical question that arises now is what is the economic consequence of the action plan — and can the world afford it?
At current, the stock markets have given a first high level data point. They have been under large pressure – and may be continue their drop, when they came to realize that contamination was not confined to Asia but was moving quickly into the Western world. They lost an estimate of US 6 to 7 trillion by end of February in the worst week since the 2008. This is equivalent to 9% decline of the equity value by end of 2019 worldwide, and up to 10% from peak achieved in late Jan 2020.1 The first week of March is ongoing with a further decline reaching -14%, with an interquartile range of -19.7% to -7.9%.2
The size of the drop is not exceptional, except that it happened much quicker than in the case of other recent high profile outbreaks (Figure 1). The Ebola outbreak by 2013 shaved around 13% of the S&P 500 in 21 trading days, for the same cut but in three times more sessions for the Zika virus (from November 2015), while SARS did decline the S&P by 7% in about 38 sessions, according to Citibank analysts.3
Figure 1 - Market reaction to diseases outbreaks
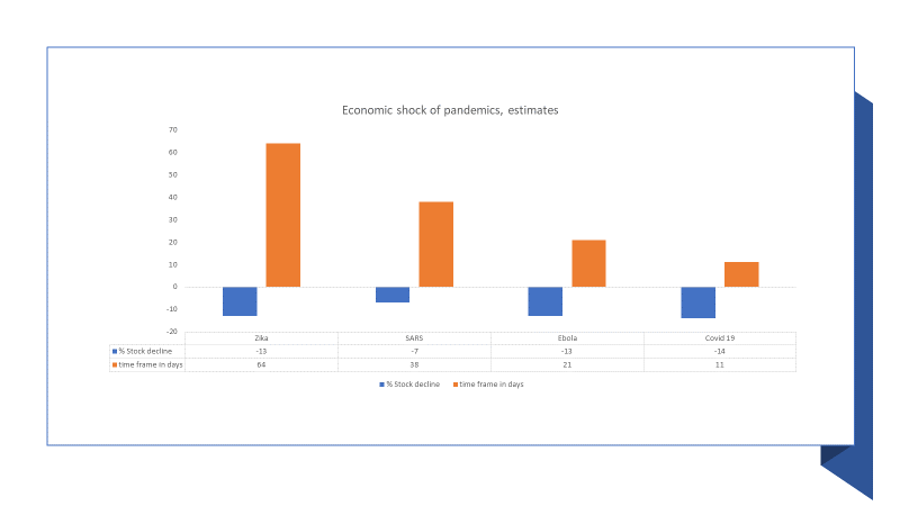
Source: Citibank, Ramelli & Wagner, 2020
The good news, says the past, is that stock markets quickly recovered when the outbreak was mastered, - a « V like » recovery. But will it be different this time? Reviewing multiple models and channels by which the virus may affect the macroeconomics and social systems, and doing own « high level » back-of-the-envelope calibration, the early high-level conclusion is that
- (Even) a controlled outbreak is a material negative headwind,
- which may be turning into a global recession, if Covid 19 maintains the same curse globally, or if actions must be massive to stabilize the curse.
By our early estimates, the return on investment on acting fast and at scale is sufficient to have economic agents incentivized to put a break on the pandemic, as it is for citizens to maintain welfare. The two critical questions are whether actions being undertaken by governments and through the support of the WHO are sufficiently pervasive and cost-effective (from what we know, a coordinated, and traced infection is yet to be deployed seamlessly), as well as whether the actions are well balanced around socio-economic groups (early evidence suggests there is no one size fits all).
2. The macroeconomic burden of influenza pandemics
There are multiple channels by which a pandemic may affect the economies. The most obvious one is through reduction of production through affected labor, then a supply side disruption, and possibly a series of demand side effects, such as inflation, depressive wealth effect, risk aversion, etc. We first look at a typical influenza, then we scale the macroeconomic burden to a potentially more severe pandemic like Covid-19.
The GDP impact from human capital
Most influenza have arisen from China, Russia and Asia.4 There seem to have been 10 influenza pandemics since the 17th century, killing a large number of people, due to generally high attack rates. We consider the average of those cases of the archetype of a strong flu, which would typically affect 1 to 2 billion people, kill 300,000 to 700,000 people out of 7.8 billion humans, if left do its curse freely.
A simple macroeconomic, labor supply-side, costing exercise would be to take the mortality rate, and the average age of those who fell victims to compute a recurring effect on GDP, due to depletion of human capital. It would also add the days of unproductive works for each time of the outbreak. A typical flu would kill individuals at both extremes of the age structure, as a « U-type » curve, e.g. younger and older individuals. The average age of casualties would be around 45 years old, creating an opportunity cost of half their work life. Given that labor stands for 50 to 60% of total added value, and considering that human capital depreciates at 3-5% a year, while real labor productivity growth has been in the range of 1.5% a year (see https://stats.oecd.org/), the yearly impact would be up to 0.1% and 0.2% of GDP of the year of occurrence, and recovery afterwards.
Now let us look at the days lost at work of the 1 to 2 billion people. Assume that one out of 60 contaminated people needs hospitalization and loses 10 days of work, while days lost for other affected people is one week out of 48, then the total effect ends up being 0.2% to 0.4% of GDP, on each year of the pandemics. If the flu comes back every year, - but this will pandemic only every 10-20 years, and will thus more like the seasonal flu, at possibly 25% effect of the current archetype, the total value effect is 0.2% to 0.3% carved out of the long-term GDP path.
Extending to more channels/effects
The above only accounts for the « labor supply » disruption. They are many more channels by which the disruption may happen:
Demand effects
For instance, there is likely a depressive demand effect, that is, the size of the health risk makes inhabitants decide to reduce consumption, e.g. in retail (nonfood), in external entertainment services, or travel/transportation,5 while the significant (fear of) a lower wealth may lead to additional reduction in spending.6 Surveys made at the time of the SARS outbreak in Asia confirm that people in Asia were willing to pay a premium to prevent risk of infection, demonstrating a risk aversion in the context of high fatality rate pandemics, with a 3% decline in demand during the quarter of the SARS acute phase.7
A second demand effect is through export and import — according to the degree of country connectivity. Given the fact that about 20% of world GDP is related to both import and export globalisation, one talks about an additional 40% pressure effect inflating the private consumption effect (as private consumption is possibly 50% of GDP).
Extra supply effects
On the supply side, there are the costs of hospitalization and treatment, but we might assume that they boost local GDP as part of the health system and services. We leave them out here is public spending is valued at cost. Crucially, there might be global supply chain disruptions, and high profile cases have reached mainstream media, such as Apple risking breakdown in its supply on AirPods and phones, if the Chinese shutdown due to the Covid-19 crisis lasts longer than the 4 to 6 weeks inventory buffer.8
Other supply chain breakdowns are linked to the provision of non-medical equipment such as masks. Ironically, the previous pandemic led to high stock of these, which were never used, and went full depreciated, with many countries not restocking, and now face an excess demand crunch. Supply side disruption is also visible in ingredients to produce virus test reactives, or in other essential drugs such as common antibiotics and vitamins, as a result of factory closure in China and other countries.
Finally, systemic uncertainty might boost the equity premium risk, at least for the countries at the epicenter, or for everyone has a result of deleveraging, or as a result of liquidity sustainability for SMBs. This has been estimated to be in the range of 100 to 150 basis points for large epidemics such as the Spanish flu.9
Recent computation by the BIS on country-specific effects of various pandemics, suggests that such premia are plausible, - possibly with overshooting in very short-term, before reversal. Emerging Asian markets plus China have suffered some extra-country loss of roughly minus 5% stock returns after 10 days after the covid outbreak in their countries. The same loss was reached after about 25 days for Japan. Whether this premium will last, and for how long, is difficult to conjecture, but China has already recovered fully since, - but not other Asian countries. Taking SARS as a different case, Japan and China cumulated loss to culminate at -10% stock return after about 50 days.10
3. Total GDP effects
Adding those effects on top of « labor supply », a total yearly demand shock of -0.2% is plausible, plus an extra supply effect in the range of -0.3% for the archetype of a pandemic flu. In total, we estimate that the total depressive effect is between in the range of 0.8 and 1.1% for GDP, as one off, before a reversal. But this may not be the case: if recurrent, when the flu goes back to seasonal, the total effect is minus 0.4% to 0.6% negative drift in GDP growth trajectory.
Possible effect on the stock market
We need a few extra assumptions to get to an estimate on the stock market impact of the pandemic. Let us assume that the debt leverage is 50% of finance, and debt costs are in the range of 3%. If capital returns are 40% of total value added, the rest being labor cost payment, then a decline in 1% in added value translates into a decline of 3 percent in earnings per share.
This does not include systemic uncertainty, that might also boost the finance premium risk, at least for the countries at the epicenter, or for every company, as result of deleveraging, or as a result of liquidity sustainability for SMBs. This has been estimated to be in the range of 100 to 150 basis points for large epidemics, or 3-5% increase, such as the Spanish flu.11 Recent computations by the BIS on country-specific effects of various pandemics, suggest that such premia are plausible, - possibly with overshoot in very short-term, before reversal. Emerging Asian markets plus China have suffered some extra-country loss of roughly minus 5% stock returns after 10 days after the Covid outbreak in their countries. The same loss was reached after about 25 days for Japan. Whether this premium will last, and for how long, is difficult to conjecture, but China has already recovered fully since, - but not other Asian countries. Taking SARS as a different case, Japan and China cumulated loss to culminate at -10% stock return after about 50 days.12
Putting all those factors together, the total stock return effect is more like 5.4 % to 8.3% in the equity markets, but bouncing back to recovery after the outbreak, a typical « V » recovery, as seen in the past. If, however the pandemic is recurrent, companies will not keep all labor; we assume then that it is put into unemployment for the extent of labor linked to the demand side effect. Further, recurring depressed earnings leads to a multiplier effect of 1.6 times on returns.13 We thus have a total effect of 4% to 6.7% a year will be taken off the stock returns paths.
If those figures are only directional, and back-of-the-envelope estimated, they nevertheless are in line with more sophisticated academic research in the last twenty years, using tools such as general equilibrium models, see Table 1. There, a typical 1 to 2 million coronavirus like flu fatalities typically will have a depressive impact in the range of 0.5% to 1.5% GDP impact.
Table 1: other study estimates of pandemic costs worldwide, pandemic flu archetype
| Source | Year | Global Scope | Percent of GDP (recalibrated) |
|---|---|---|---|
| ABD | 2005 | 1 to 2 million fatalities | 2.5% (Asia only) |
| WHO | 2018 | Average flu type (1-2 million) | >0,6% |
| Brookings | 2020 | Moderate flu (2 million) | >1% |
4. Calibrating to Covid-19 – back to last economic crisis?
Covid-19 as we have highlighted, is possibly a stronger pandemic than the flu. Also, Covid-19 has different medical features that will affect the size of the economic channels? For example, Covid-19 sufferers have longer time of hospitalisation and recovery, in the range of three times the one of the flu. Covid-19 might have larger fatalities than the flu, while the reproduction rate is higher also, leading to higher attack rate too, than the pandemic flu. What is also unique about a pandemic like Covid-19 is that it is spreading worldwide, with a high risk of a depressive loop of lower supply, lower demand, etc. This effect might double the typical national effect.
Factoring this as back of the envelope, the total range looks more like a decline of 4.5%-6.5% impact on worldwide GDP, or a 3.5 to 4.5 trillion US yearly GDP shortfall. If the pandemic lasts the 6 to 10 months average, and there is no cost for supply chain to rebound as well as for consumers to return to normal spent, we may talk more to 2 to 3 trillion USD in a year, or a 2.5% to 3.5% growth dip, but if this takes longer, and there are costs to relaunch the world economy, the long term effect may build up higher than 5%-6%, in line with other external estimates (see Table 2).
Table 2: estimates of pandemic costs, Spanish flu
| Source | Year | Global Scope | Percent of GDP (recalibrated) |
|---|---|---|---|
| World Bank | 2013 | Spanish flu (40 to 70 million fatalities) | 5% |
| Brooking | 2020 | Spanish flu (40 million to 70 million) | 6% to 10% |
This impact figure also implies three critical points:
- The first is that the pandemic effects on the world economy may lead at best to a flattish year versus 2020: from roughly 3% benchmark to at best, between 0% to 1%, by 2020.
- The second is that this is serious — at full costs, the world will be suffering as much, of not more than the crisis of 2009.
- The third is that, the effect on equity value may also climb three times the one of the flu, up to decline range between 13 to 24 % of the total equity markets in the short term. If the economy fully recovers after the Covid-19 pandemic, the effect on stock market path will be a « V » recovery. If however, the recovery takes time at half rate, or leverage adjusts to the bear market, the blip might cost 3% to 9% of total equity value of stock market, or roughly net 3 to 9 trillion USD.14
Typically, we have witnessed such a material drop in recent weeks on the stock market. A fortiori, related stock price of sectors most exposed to pandemic outbreak, e.g. on the demand side, automobiles, retailing (nonfood), external or theatre entertainment are hit accordingly. Other sectors also affected are those where systemic risk light increase linked to the pandemic, e.g. (health and unemployment, and life) insurance, or banks/real estate customer solvability risk (Figure 2).
Figure 2: Most hit sectors during pandemic come from a demand side effect
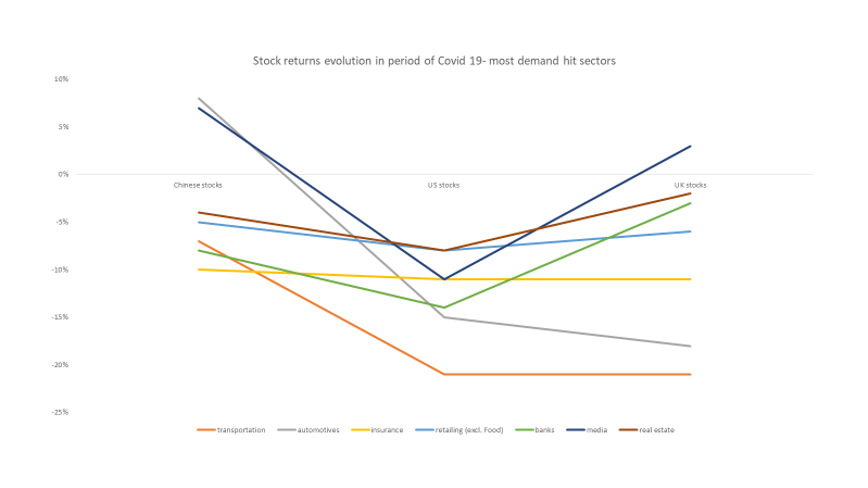
Source: Ramelli and Wagner, Griffiths et al, Instiute of Fiscal Studies
5. The Return to controlling Covid-19 diffusion
Clearly, the insight from the simulation is that if Covid-19 is free to diffuse, not only the human costs will be high (tens of millions of deaths) as will be the economic costs, implying in all logic, a possible recession.
In a separate post I mentioned a set of levers and actions, and the need for speed and agility to implement them at a global level. What is critical is both to identify and block super-spreaders, to limit false negatives in the virus infection, and to stop any new node of the virus deployment, mostly by major social distancing, quarantines, and closure of social spaces for a few weeks/month(s-) at work, at school, etc. If this works, and reduces the reproduction rate by 0.5% people, and if fatality rate is reduced by 50%, the total GDP effect may come down from 4.5%-6.5% effect to 1 to 2%, or a gain of 2 to 3 trillion US dollars a year.
Leveraging the cost estimate at the world bank (Jonas, 2013, Pandemic risk, World Bank) as well as community studies led by Joel Kelso and colleagues (see Kelso et al. 2013 Economic analysis of pandemic influenza mitigation strategies for five pandemic severity categories. BMC Public Health; and Milne et al, 2013, The cost effectiveness of pandemic influenza interventions: A pandemic severity based analysis. PLoS ONE), the fully loaded disruptive costs of avoiding affection might be less than 1 to 2 trillion, enough to suggest a positive return of investment.
We thus learn that a short term programmed of assets closure, combined with systematic quarantine of the contaminated has a positive return if the virus outbreak has large damage; it does not have a good ROI if the outbreak is like a pandemic flu. The ROI is even larger if the economic recovery takes time, and/or alternatives to limit the outbreak, like a broad vaccine are a distant future. In this case, there is clearly a convergence of health and economic incentive to implement large and pervasive barriers to flatten the curve of diffusion of the virus, as well as to deliver fast.
© Jacques Bughin. Written March 04; revised March 20. Comments more than welcome. All errors are mine. References listed as they are found in the text
-
See https://www.cnbc.com/2019/12/24/global-stock-markets-gained-17-trillion-in-value-in-2019.html, for a Deutsche Bank estimate of the value of the global equity markets. ↩
-
Ramelli and Wagner, 2020, Feverish Stock Price Reactions to Covid 19, University of Zurich working paper. ↩
-
See https://www.cnbc.com/2020/01/28/market-reactions-to-major-virus-scares-show-stocks-have-more-to-lose.html. ↩
-
See Shortridge and Stuart Smith, 1982, An influenza Epicenter?, The Lancet. ↩
-
At the peak of SARS, Hong Kong saw an 80 percent reduction in air traffic as well as a 50 percent reduction in retail sales (see Siu A, Wong RYC. Economic impact of SARS: The case of Hong Kong. Cambridge, MA: MIT Press; 2004. (Asian Economic Papers)). ↩
-
See McKibbin and Fernando, 2020, the global macroeconomic impacts of Covid-19: seven scenarios, Brookings. ↩
-
See Bloom et al. 2004, potential impacts of the SARS outbreak on Taiwan economy, Asian economic papers; see also Lee and McKibbin, 2003, globalisation and disease: the case of SARS, Asian economic papers. ↩
-
See https://www.latimes.com/business/technology/story/2020-02-07/apple-supply-chain-threatened-by-coronavirus-quarantines ↩
-
See McKibbin, 2006, Global macroeconomic consequences of pandemic influenza, Lowy Institute for International Policy. ↩
-
See Avalos and Zakrajsek, 2020, Covid 19 and ARS : what do the stock markets tell us, BIS Quarterly Review, March. ↩
-
See McKibbin, 2006, Global macroeconomic consequences of pandemic influenza, Lowy Institute for International Policy. ↩
-
See Avalos and Zakrajsek, 2020, Covid 19 and ARS : what do the stock markets tell us, BIS Quarterly Review, March. ↩
-
See Hodson and Stevenson- Clarke, 2000, Earnings, cash flows and returns, functional relations and impact of size, Accounting and Finance. ↩
-
This is simply the cost of time, at 12% real equity return. ↩