COVID-19 requires a massive recovery plan to stay on our welfare growth trajectory
-
-
-
-
J. Bughin
Dr Jacques Bughin, UN consultant, Solvay Business School ULB, Portulans Institute and G20Y, former Director McKinsey Global Institute, and senior partner McKinsey & Company.
1. Introduction
April 20
The current coronavirus outbreak has already claimed more than 160,000 lives worldwide, according to recorded statistics. As a result of the pandemic, a significant lockdown has been put in place worldwide, especially in order to flatten the curve of the pandemic in compliance with hospital capacity. The consequence of the containment actions has been already been made clear by many economists that this would lead to an economic reduction in the range of more than 10% of worldwide output in first semester of the year, or close to 3% for the full 2020, under an optimistic? “V”-like rebound (see https://www.oxfordeconomics.com/coronavirus).
Economic activity measures are an important metric to gauge the pain of a major outbreak, but they also are likely to understate the true citizen consequences, given other non-GDP impact, of which the most obvious one is a healthy life.
If, instead of looking at GDP change only, we take a simple version of economic welfare change, this will be essentially driven by the product of healthy life expectations change times the flow of certainty-equivalent income. Regarding life expectations, this would be a reduction in welfare, as COVID-19 is firmly putting itself in the list of the top 15th largest pandemics back to the 14th century. It is already converging to the rate of deaths of the 2009 H1N1 outbreak. This number of deaths continues to escalate as COVID-19 death claims have doubled in just 10 days worldwide according to Worldometers statistics. Regarding income change, this is more or less the same as the GDP change, a shrinkage of labor supply, as well as a reduction in aggregate demand. Further, forced lockdown reduces economic output - and as seen in the reaction of the major, (even unprecedented) stock market reactions worldwide. Uncertainty is however another important factor, affecting the utility of citizens, as uncertainty as to the severity and duration of COVID-19 may lead to major worries on personal situations.
By looking through this lens, high level figures suggest that welfare may be significantly affected, in the range of more than 10%, or a significant decline for 2020, if no recovery is assumed. Compared to an annual welfare growth in the range of 2% to 3% a year, this means that the COVID-19 crisis may eat more than 3 years of welfare built up in the past for our citizens. Looking this way, this is a bigger reduction and a longer time to recover from COVID-19 than usually said. We are thus to do everything to limit such welfare loss to our society, including allowing anything to suggest a fast and large recovery plan, at the level of impact never heard of, of the welfare loss induced.
2. Measuring welfare at high level
There have been some measures of how pandemics may depress GDP growth. Mild effects results in a decline of 0.8% to 1.5% in a year, but can quickly build up to 3% to 5% decline, for major pandemics.1
GDP however may fall short of many impacts to welfare. Forced unemployment, inequality in containment measures, or still mortality risks, are some of the major factors affecting living standards that are incorporated imperfectly, if at all, in GDP. We leverage work by Jones & Klenow, (2016) to define welfare change as an evolution of consumption equivalent. In particular, under its simplified version, the relative change in Welfare due to the COVID-19 pandemic, noted by \(D(W)\), is the sum of relative change, \(D\), in healthy life expectations \(EL\), and of change in certainty equivalent income \(D(CI)\), or:
We further assume a constant risk aversion,
where \(I\) is disposable income, and \(s(I)\) is its standard deviation.
Combining (1) and (2), we have (3):
Equation (3) simply states that COVID-19 will have a negative impact through a reduction in \(D(EL)\) (increasing weeks of illness, and mortality rate), a reduction in \(I\), through lower economic activity and income, and a possible volatility of income.
3. What do we know about how COVID-19 plays on welfare?
Effects on healthy life
COVID-19 has a clear negative impact on healthy life. Regarding morbidity, and considering a reproduction rate, \(R_0\), of 2.3, and an asymmetry of contamination events like the flu, there is a potential of about 65% of individuals eventually affected. At this level, there should be 50% asymptomatic cases, and for the rest, 43% mild cases, and 7% requiring hospital treatments, with longer recovery time (20 days) than the mild cases (15 days) (see Riou, et al, 2020). Regarding fatality effects, the current crude rate of death is close top 7% worldwide to date, but this rate is a large overstatement of the true fatality rate, as it is computed on recorded infections, which themselves are mostly done at hospitals for lack of enough testing capacity. Using the statistics above (Riou, et al, 2020), the consensus that is emerging is a fatality rate in the range of 1%, assuming that severe cases are treated.
This rate, however, suggests that there is enough hospital capacity to handle the crisis. This is likely not to be the case as currently, there are about 1.5 beds for 10,000 households. We estimate from basic epidemiologic modelling that the peak is happening at 23%-25% of population, after about 70 days, if COVID-19 runs its course freely. As 7% requires hospitalization and 1/3 would need ICU equipments, we talk about a simultaneous bed capacity at peak of 5/1,000 person, or virtually, 97% patients at risk of no hospital capacity. Taking the full curve, 90% requiring ICU may be at risk, which means that the fatality rate may be as large as 2.8% of infected, in the case of no control measures implemented to flatten the pandemic curse.
Income effects
As a side effect of a depreciation in healthy life, the COVID-19 pandemic creates an opportunity cost for time not worked, affecting GDP downwards. As made clear in a previous blog, other depressive effects will also be co-existing. The first is a reduction in demand, e.g. in retail non-food, travel/transportation, etc. The stock exchange shock has been relatively large, with stock valuation volatilities larger than for Oct 1987 or during the Great Depression. This entails a lower wealth effect, which in turn, would lead to additional reduction in spending (McKibbin and Fernando, 2020). There might be significant supply chain disruptions, too, in particular as seen in the healthcare equipment provision.
Assuming the pandemic can run freely, the total effect we have estimated elsewhere in a previous blog, is in the range of -0.8% and -1.1% for GDP, for a typical flu. This can be boosted to 4 to 5 times in the cases of the COVID-19, or a decrease in the range of 3.2% to 5.5%, assuming no rebound.
In the case of major containments, the economy takes a much larger hit. Typically, 65% of the economy has been shutdown out through physical distancing, and for those working at home, productivity is 80% the level as a result of absence of complementary capital, and other negative externalities (less team gain, loss due to take care of family in the containement, etc). This results in a drop of 20% for a month. In China, for instance, industrial output fell in the first two months of 2020, by more than 13.5%, while investment fell 25% year-on-year (and 30% when it concerned infrastructure only); consumer retail sales collapsed by 20%. As shutdown seems to operate for two months, and some partial containment may be needed, in the next 6 months, at 20% of total, to contain the outbreak, a total drop is possible in the range of 6%-7%, outside any rebound.
Uncertainty effects
Last but not least, uncertainty induced by the COVID-19 will further reduce income. The reason is that:
-
Even absent all policies of containment, COVID-19 may build uncertainty quite a long time. For example, most of pandemics lasted for a period of 8-16 months, with the 1918 Spanish Flu lasted 16 months, across three waves. Mathematically, the peak, at current epidemiologic features of the COVID-19, would typically happen in the range of 2.5 to 3 months, with a fraction of contaminations at about 35% at that time. As two times more people still would be eventually affected, but at a rate of transmission three times lower on average until the end of pandemics, this means an extra time of 6 times the peak, or still 15 months to go. The total time might thus be >1 year, if it spreads to all susceptible population. At this level of continuous risk, pressure on wages may prevail, if it is compounded by higher risk on unemployment. Likewise, consumption will be pressed downwards (Barro et al., 2020).
-
If shutdown is used as a way to flatten the pandemic curve, the economy will be challenged, as it creates disruptions that are difficult to re-absorb afterwards in a smooth V shape scenario. We believe it will be more like a U shape. As example, following shutdown, unemployment has significantly increased. ILO for example is recently predicting 195 million full-time jobs destroyed worldwide because of the pandemics. 5 million people in China lost their jobs during the pandemic, while more than 10 million Americans just applied for government aid. Upon return to normal, unemployment may not come down automatically, as some jobs may remain risky as front line, or some unemployed will have significantly human capital eroded. Likewise, most SMBs have barely 2 months of cash to assets, leading to major risk of bankruptcy in the medium term. Those would close a channel for people to rebuild their work opportunities.
4. A significant reduction in welfare
Taking those high level impacts, we can now compute the change in welfare. We compute it for both cases of containment and non-containment, under our base line assumptions. The findings are:
-
A significant drop in welfare in any of both cases, that can be above 10% if there is no recovery, but mostly possibly if recovery is done at 50%, a peak decline at -8%.
-
A better case for containment, with -5% reduction of welfare versus -7% by end of one full year.
-
The difference arises because of mixed effect, as in non containment case, a large loss is due to excessive (by definition) non recoverable deaths, and a major dip in economics, which implies a higher rebound for the same portion of recovery.
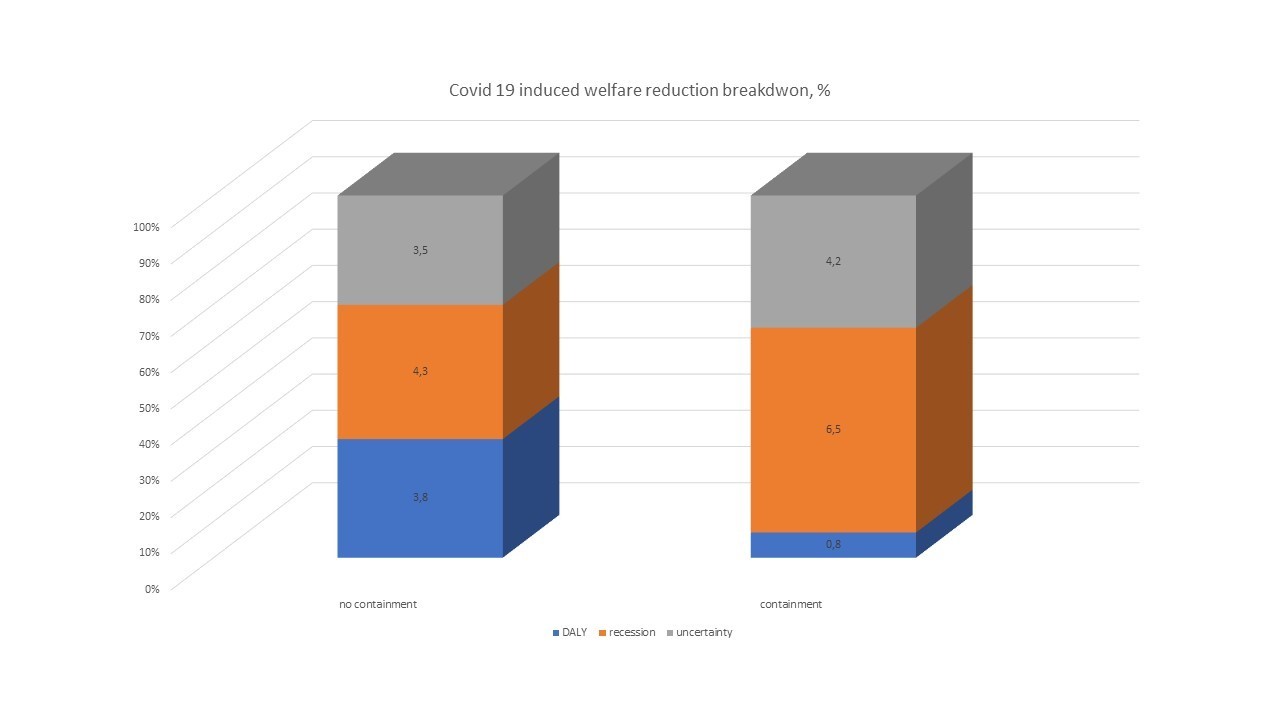
How do we get to those findings? Consider the non containment case and no rebound, we end up towards a total of minus 10%-13%, as computed as follows.
-
\(D(EL) = -3.8\%\); There is a reduction of 2.0% of healthy time (35% of people with symptomatic infections, of which 80% sick for 15 days, and 20% sick for 20 days as more severe cases), as well as a reduction of 1.8% due to death, and under the hospital constraint significantly binding.
-
\(D(I) = -3.2\%\ to\ -5.5\%\); (As per previous blogs)
-
\(-s(I)= -3.5\%\); We use here a set of triangulations for this figure. First, we use the findings by Baker et, al. (2020) which calibrate a model of economic growth based on implied volatilities in consumer sentiments and from the stock market VIX, that concludes to a volatility depressing economic activity by about 5% in one year in the US, including shutdown. Second, we use change in perception of personal economic situation based on perception on the severity of the COVID-19 outbreak, as computed by Fetzer et al. (2020). There is 0.16 standard deviation of percent income depression for the group feeling that COVID-19 is severe versus the other group that feels it is mild, thus \(-\frac{s}{I} = -\frac{0.16}{5} = -3.5\%\).
Consider now the containment case (and still no rebound), we end up towards a total of minus 10%-13%, as computed as follows:
-
\(D(EL)= -0.8\%\); There is a reduction of 0.6% of healthy time as we assume that recurrent measures of containment leads to meet ICU capacity, leading to a decline of attack rate by 2/3 in total, while fatality rate is only 1%.
-
\(D(I) = -6\%\ to\ -7\%\); (from above)
-
\(-s(I)= -3.5\%\ to\ -5\%\); (as per above)
From those computations, it is notable that containment goes for higher economic costs and lower health costs, than in the case of let the virus freely evolve in the economy (see Figure 1).
Figure 1: Gross welfare decline due to the COVID-19 - with or without containment measures
Using the same figures, we can build up the evolution by quarter in function of the dynamics of the attack rate, and assuming that recovery starts after peak period, with a lag of one quarter (Figure 2). Even at 100% recovery, we do not fully recover, given death tolls, and (in this modelling case) because recovery is delayed by one quarter.
In general, welfare has been increasing by about 2,5% a year (1% healthy life, and 1 to 1,5% of certainty equivalent income), thus the scenario of COVID-19 will be a yearly dip in welfare, even ingesting the positive welfare trend of the past.
Figure 2: COVID-19 Welfare evolution in function of recovery
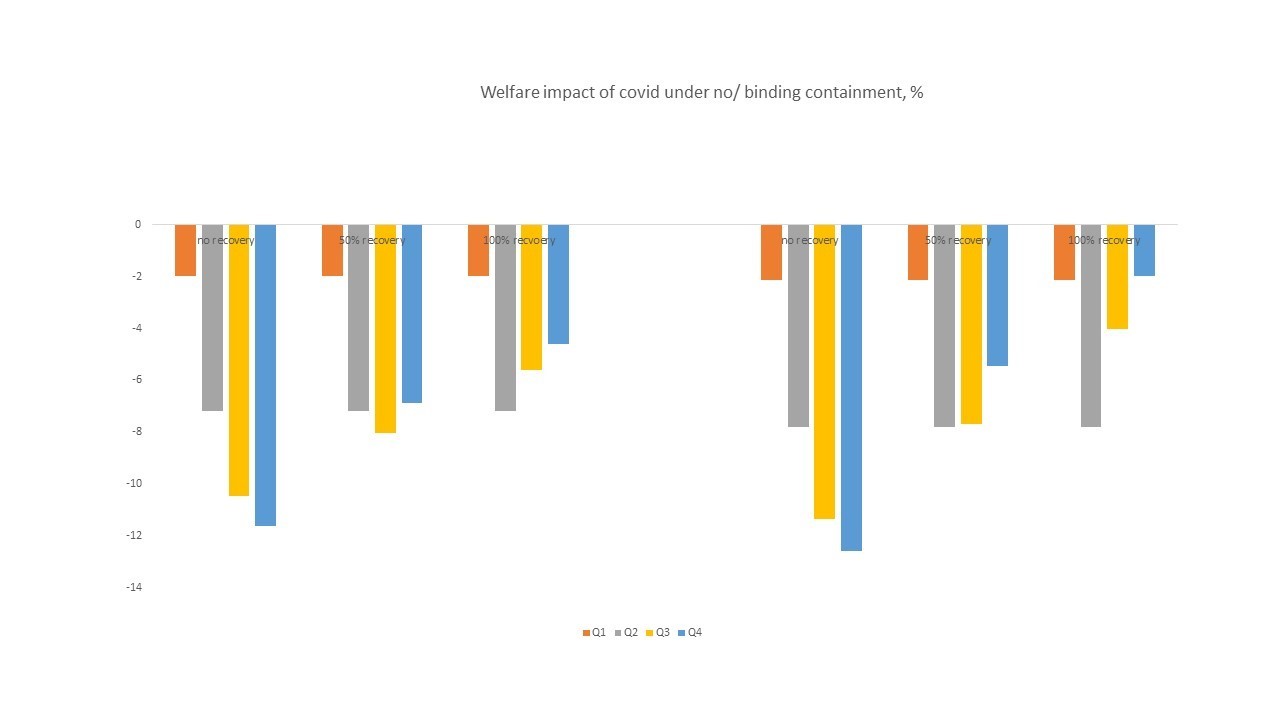
In general, welfare has been increasing by about 2.5% a year (1% healthy life, and 1 to 1.5% of certainty equivalent income), thus the scenario of COVID-19 will be a yearly dip in welfare, even ingesting the positive welfare trend of the past. We thus need to work on a plan to successfully still crush that virus, but also a major plan for fast recovery as well as extra spending to rebuild towards a positive welfare enhancing trend for our society.
5. References
Baker, S., N. Bloom, S. Davis, K. Kost, M. Sammo, T. Viratosyn, (2020), “The unprecedented stock market reaction to COVID-19,” CEPR, Covid economics, Issue 1, April.
Fetzer, Th., Hesnel, L., Hermle, J., and Ch. Roth, (2020), “Perceptions of coronavirus mortality and contagiousness weaken economic sentiment”, ArXiv.
Jones, Ch. and Peter Klenow, (2016), “Beyond GDP? Welfare across Countries and Time,” American Economic Review, vol 106(9), pages 2426-2457.
McKibbin and Fernando, (2020), “The global macroeconomic impacts of Covid-19: seven scenarios,” Brookings.
Riou et al., (2020), “Adjusted age-specific case fatality ratio during the Covid-19 epidemic in Hubei, China, January and February 2020,” MedrXiv.
© Jacques Bughin. Comments more than welcome. All errors are mine. References listed as they are found in the text.