What to do after the 1st wave of the COVID-19? A 10 points roadmap
-
-
-
-
J. Bughin
Dr Jacques Bughin, UN consultant, Solvay Business School ULB, Portulans Institute and G20Y, former Director McKinsey Global Institute, and senior partner McKinsey & Company.
In a recent article regarding the impact on COVID-19 on our economies, I have used a more broader “economic welfare” approach than GDP alone to compute the size of the challenge we face. The insight is that fighting the COVID-19 by “all for one, one for all’ containment or letting it go, will be generating a welfare loss with an impact for the total curse above 10 percent decline. This is a major hit - any way we look at and react to COVID-19.
1. Welfare model update - confirmation of the loss, but also that we are at the start of the journey
This sizeable effect on welfare has been parametrized by some key assumptions. We have updated, that is, refined some, for this research. This includes a refined “Susceptible Infected, Recovered (SIR)” model of contagion, based on an original epidemiology contagion of \(R_0=2.5\), that ultimately predicts the portion of infected. But contrary to the referred article, we further “endogenize” the demand side, in that we anticipate that segments at risk of being at higher risk of being infected (e.g. the old group segment) will adapt and reduce their contact rates as a self-protection, reducing in part, the final size of the pandemic. We also have adjusted the fatality rate to 1 percent, (under no healthcare constraints), in line with new data that make fatalities likely lower than the original crude rates of 3-4%, from the start of the pandemic in China (Riou et al, 2020).
With the new changes, we end up with a reference scenario of COVID-19.
-
infecting 55 percent of the population,
-
for a peak of infection happening at about 30 percent of population being contaminated. After this peak, - also called herd immunity point -, new infections will continue to arise, but with a decay, up to to no infection emerges.
-
The total welfare for this curse is slightly below 10%, thus, a confirmation of a major hit to our economies
-
With only 5-10% of people infected versus at total potential of 55%, we may infer quickly that we are far from being finished with COVID-19, and we might expect to live long with it, and/or to see new waves of outbreaks if we do not manage to contain the contagion, as we just did in Wave 1. We are thus in an absolute imperative to learn fast from the mistakes many countries have done during the first wave, in particular, we are also in the need to do the containment differently, as it brings, and upload in time, the same level of welfare loss as the pandemic itself.
2. Uncovering what works, what doesn’t
Let’s look at the different drivers of COVID-19 welfare loss to have a better fact based on what works, what does not.
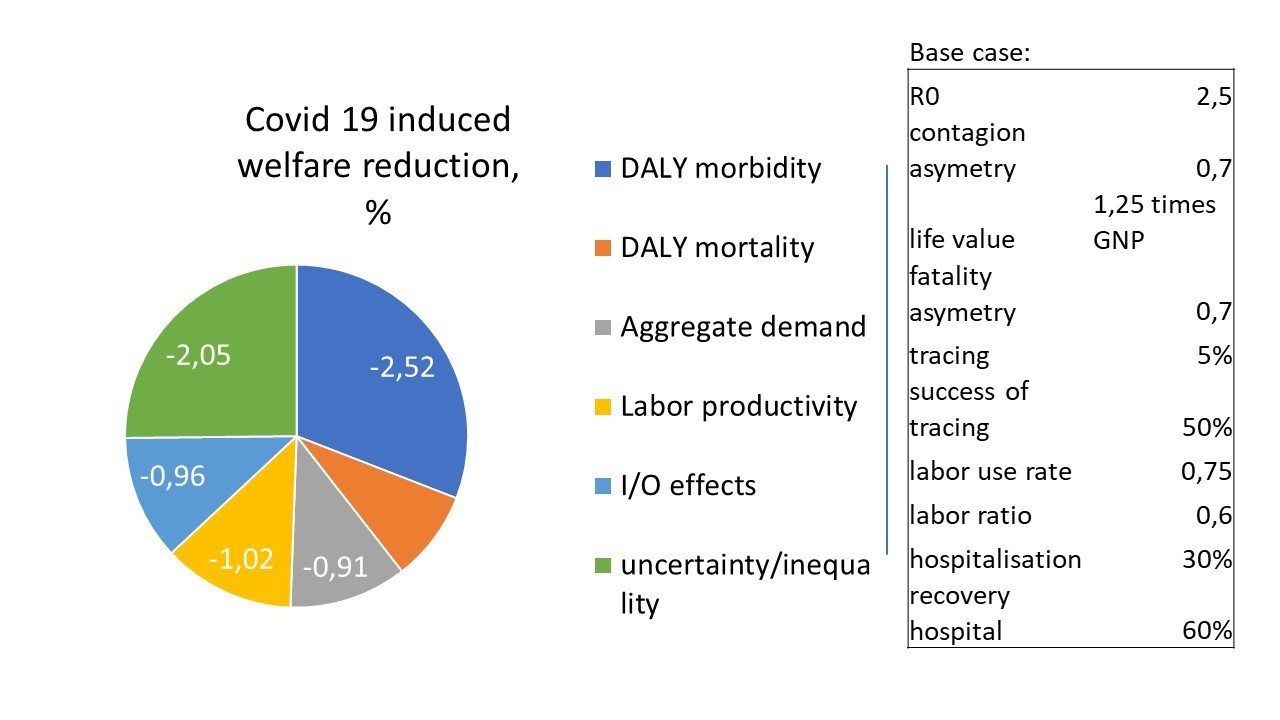
The welfare loss originates from three components (Figure 1): The first is the DALY (disease adjusted live years) reduction in terms of sick days and mortalities. The second is the income loss from labor productivity loss , magnified by an I/0 multiplier and a demand reduction for precautionary reasons (e.g. in retail non food entertainment transport etc). The third component is the large disparity linked to the outcomes of COVID-19, e.g., the contaminated may die, while the non-infected may suffer from income loss, etc.
Figure 1: The various elements of welfare loss - (case of free curse of the Coronavirus)
3. How to prepare the next round?
In order to break those loops, let’s first look at the list of key drivers that affect the dynamics of the welfare loss. We specifically look at 10 drivers, as shown as a 10 percent change of driver to welfare gains (Figure 2).
Figure 2: Rank of drivers to COVID-19 welfare loss
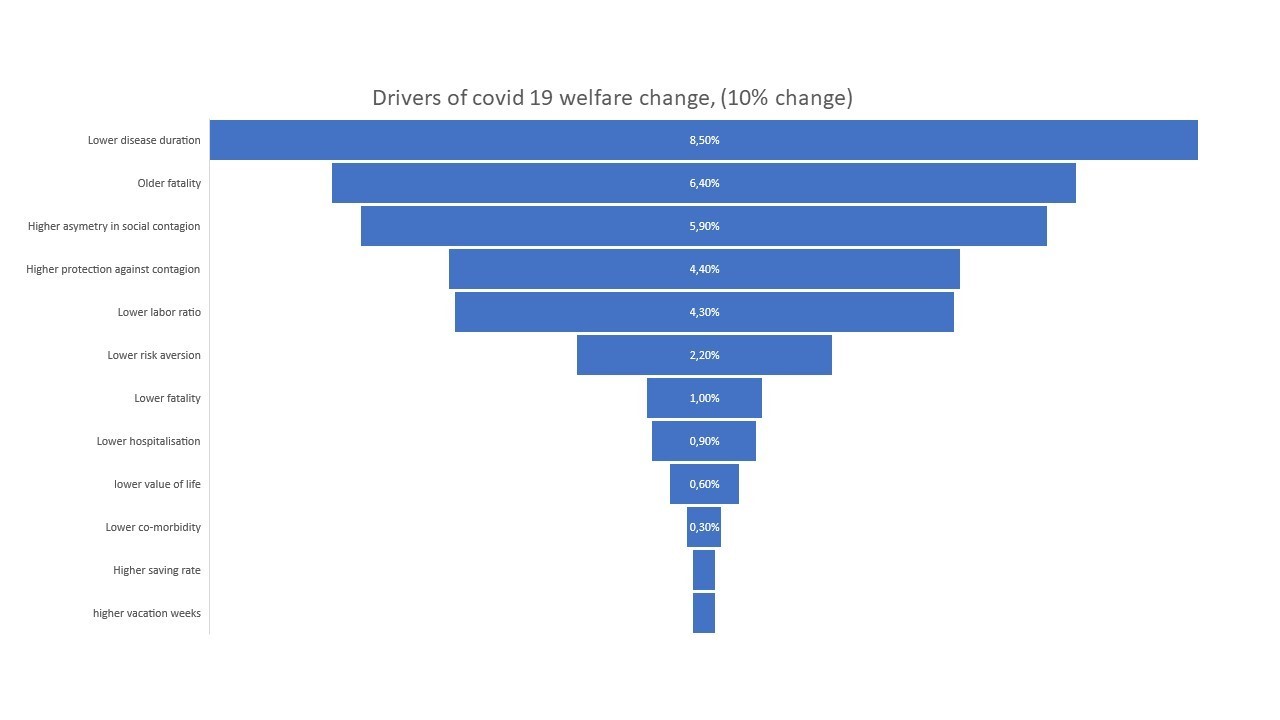
We note a few critical points:
-
Most of the drivers are “inelastic”- that is, a 10 percent increase in any of the driver never increases welfare by more than 10%, or proportionately. The reason is that no lever plays on all three components of welfare.
-
If all of those drivers are being played at once in the right direction to increase welfare the total gain is material, yet still less than 30% improvement. We thus have to play “at scale”, up to 30% improvements on levers if we want a radical regain of welfare. This in practice, is likely impossible, as many drivers are pretty sticky (e.g. co-morbidity, labor ratio, saving rate, etc)
-
It is evident that this is a pandemic that will affect a large amount of population, and among others, the working population. It may be more insulated from death, but will have its hit on sickness impacting labor productivity significantly, and further, depressing demand. Given this sickness impact, we should also carefully check how we can make it less costly to our welfare.
-
Today, we have look rightfully at the worst cases (hospitalisation), but we need to integration the full journey. Today, the “figures do not foot”. On average, we have a fatality rate of 0,2% outside hospitalisation, but moving to 6% (times 12) under hospitalisation, and up to 30% (times 5) if going to ICU. This is extremely skewed. Age without morbidity) fatality rate moves up to 6% fatality for people above 80 years old, and twice that, if we account for their morbidity. Those numbers are on average smaller than when the average patient goes to hospital, - thus questioning the time effectiveness of hospitalisation - are we too late in handling risks?
-
We should make sure we have a way to continue to improve curing. Trying multiple treatments is fundamental, especially, anti-virals, etc. We also have to have diagnosis right, e.g. understand better to cure better, e.g. the interference of COVID-19 with e.g. cardiovascular disease. Progress remains minimal here, in terms of co-morbidities.
-
The more you play at the source, that is, on the extent of the contagion, the better you are. In particular, this means protecting those with higher risks, and creating ways to mitigate or internalize the risk of contagion. Mitigation may happen by invoking morality, or still by punishing lurking or cheating. PS: A norm may be a fine per third party contact of more than 800 USD, as the value of lost life is roughly 50,000 USD (given age profile for COVID-19), and \(R_0=2.5\), and 15 contacts per day, we come to \(\Big(\frac{50,000}{15}\Big)\times \Big(\frac{2.5}{10\ days\ contagion}\Big)=833\ USD\).
-
Regarding contagion, it is evident that a way to trace and systematic quarantine of the infected, - and its close circle, is the only structural enabler that scales (see my previous article, or Christoph and Gunther, 2020), - and in particular via technology. If we make only 50% of tracing and 50% right, we increase welfare by 40%, more than playing on all levers together by 10%. This is easier to do as we play only on one lever to pull - not 12 in the list above.
-
Last but not least: something not to think and do. From figure above, welfare might seem to improve if we had the tautology that “only people in last stage of life die”. This result follows simply from the fact that their DALY impact will be smaller, and their contribution to economic activity is lower than others, as they have retired. This of course is an artefact of the restrictive wy we measure (only) economic welfare from remaining time to live. Another alternative would be to look at willingness to pay by age, - that clearly shows that actual perception of value of life does not decrease generally - and if any, only a bit by maximum 20-30% after 70 years.1 Likewise, under the permanent income hypothesis, older people may have a higher value of life than others, as their death includes larger consumption loss.2 If we include those two effects, (permanent income and willingness to pay), the total elasticity we estimate collapses to zero.
4. Roadmapping the future
Based on the above, let us make a simple sketch of how to manage the future of the COVID-19. This is a 10 points proposal to be further shaped:
-
Migrate to an extensive tracing technology, and build an mandatory containment, in exchange of a guaranteed compensation, why not the compensating value of not putting people in danger - the value as said above is 850 USD per day.
-
Protect the key segments under risk- this includes the people above 65 years, and those with key morbidity risk, especially cadio-vascular, diabetes, for instance. Regarding the old, a special focus on home care must be done, that should preempt the entry of the virus into the home care, and from the shared services side.
-
Extend the capacity of hospitalization, both for events of new wave, for pre-loading growingly risk profiles, etc.
-
Provide all means of protection, that is, easy and freely available masks, gloves, and others. This includes major disinfecting means of shared assets and services (food services, transports, etc). This includes tools to allow entries into shared services, like the Alibaba red/green signal technology.
-
Boost human resources for health care across the full value chain - including detailed check points of temperatures, symptoms, via call feedbacks, or automated call platforms.
-
Fine tune the contact intensity - experiment rollout by regions (work in one, stay home for the others, etc); - try 4 days a week work, under rollout over a 7 days week, etc.
-
Build a very large communication tool to make sure we still have the population to cooperate and to internalize the negative contagion opportunities. Communicate on the impact of poor social distancing on global recession, communicate on the impact of social distancing, on own probability to get sick.
-
Integrate a full supply chain of health. Not only the hospital, but all constituents, including pharmacies, doctors, kine, etc.
-
Mobilise local industrial resources to avoid dependencies of international value chains.
-
Integrate a major plan to compensate for the economic disruption (this must include finance bridge to SMB) but also for judo economics towards re-growth - in particular, it is time to integrate a plan for a) sustainable technologies, b) for cooperation R&D for antivirals and vaccines, among others.
Be this roadmap shaped and executed as soon as possible in order to rebuild our welfare - they are worth 10% of our welfare.
© Jacques Bughin. Written April 24. Comments more than welcome. All errors are mine. References listed as they are found in the text
-
See Alberini, A., Cropper, M., Krupnick, A., & Simon, N. B. (2004). Does the value of a statistical life vary with age and health status? Evidence from the US and Canada. Journal of Environmental Economics and Management, 48(1), 769-792. ↩
-
See Kniesner, T. J., Viscusi, W. K., & Ziliak, J. P. (2006). Life-cycle consumption and the age-adjusted value of life. The BE Journal of Economic Analysis & Policy, 5(1). ↩