Fighting the virus requires to know its habits better and for us to rethink our social interactions
-
-
-
-
J. Bughin
Dr Jacques Bughin, UN consultant, Solvay Business School ULB, Portulans Institute and G20Y, former Director McKinsey Global Institute, and senior partner McKinsey & Company.
- Introduction
- Imposed social changes: multiple flavors
- A Belgium case study
- Simulation results of Belgian outbreak developments
- The importance of redefining social interaction and know the enemy
- Epilogue: Where might Belgium be on the outbreak by May 1?
1. Introduction
April 4
COVID-19 has passed 1 million recorded cases and is driving a crisis feared to be like “no other,” - with many countries in economic standstill. The tension is clearly building between saving lives and saving the economy. Yet both can be reconciled if we adapt our model of social connections, and we kill a large set of remaining unknowns about the COVID-19 virus, that drives a lot of excessive protection to date.
2. Imposed social changes: multiple flavours
There have been quite some discussions as to the best policy model to actively manage COVID-19. Three models have been tried. Countries such as China, followed by many Central and Southern countries have been going for enforced social distancing, while some other countries such as Scandinavia (notably Sweden) have go for self-responsible containment. Other countries, like South Korea, have been playing the card of extensive testing and individual tracing.
It is relatively known that testing and social tracing is especially effective, but to the extent it is started early in the pandemic, and to the extent that the asymptomatic cases remain low (so that testing is sufficiently effective). Despite the poor specificity of current testing, the current evidence is that countries with extensive testing have been more able to control the pandemic.1 Yet, many countries in Europe have been resisting such extensive tracing, usually in the name of privacy, and in memory of watchdog governments (Germany, and Eastern Europe).
When it comes to directed containment, the economic costs may become excessive especially (in the range of 10% and more of GDP) if this lasts long, - and this may be the case in the COVID-19 situation, especially if the policy was set up late and takes time to control the pandemic. Italy implemented the shutdown of the country when more than 800 people passed away, while France, a country of the same relative population size, locked down the country just after about reaching four times lower fatalities than Italy. By winning one week in the race, France today has still 2/3 of recorded infected cases, and 15% higher illness recovery than Italy.
When it comes to a “more laxist” containment, - or one which is left to the entire responsibility of citizens -, the bet is that the spread of the virus may be left to develop, and build natural immunity, without in parallel adding the economic cost of shutdown. The risk is that virus spread may escalate rather quickly and could overwhelm the health care system before natural immunity might be built in. UK actually shifted gears to more directed containment, after it realized that a milder model may not work.
Independently of the model used, three important messages must remain;
-
The first is scale and speed. Social contact reduction must be large enough and operate fast, in combination with self protection, for the virus to peak, -and the more so, the larger the number of non recorded cases that may be contagious.
-
This social contact reduction may not need to be uniformly distributed - it may be indeed wiser if it is applied strictly to social ties of the infected so to avoid too large economic costs.
-
The third message is to reduce the unknowns. COVID-19 must be understood much better than today, eg whether asymptomatic cases are contagious, how can they turn themselves into casualties, are relieved patients immune and non contagious, and for how long - as all those questions fundamentally condition the ability both to curb the pandemic, as well as to design the minimum viable solution for our social interaction change.
3. A Belgium case study
To back up those two messages, I rely on calibrating a model of COVID-19 fatalities applied to Belgium, at the date of April first. At that time, COVID-19 has killed slightly more than 850 people, and now the total casualties are close to 1,600.
Belgium to date
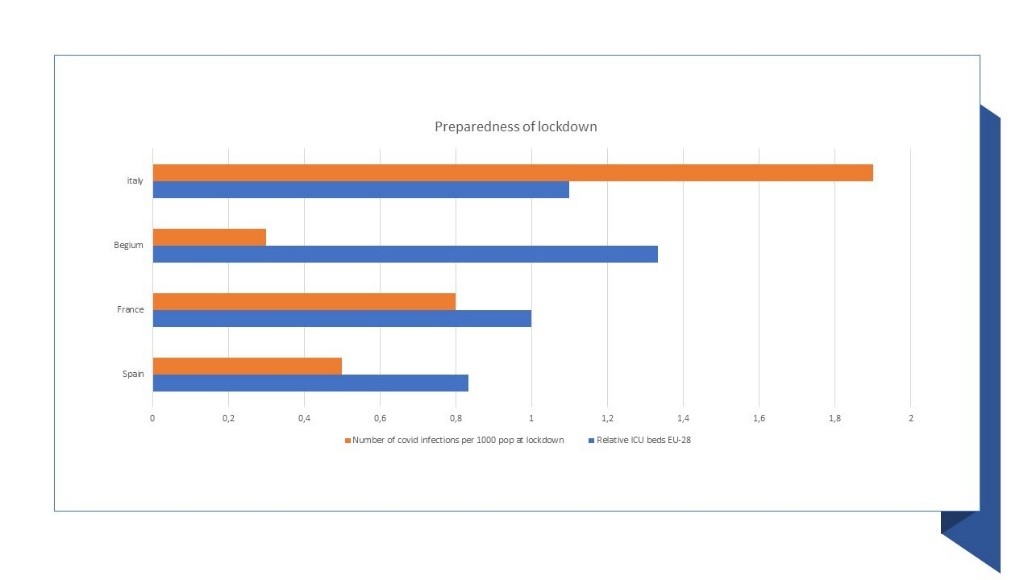
On the positive side, Belgium went quickly into active containment in Europe, and possibly one of the fastest countries to act on imposing strong measures, only after a few COVID-19 deaths. In effect, Belgium has possibly taken first measures faster than say Italy and Spain, and is in the top 5 in EU-28, in terms of ICU bed capacity.
Also, a good policy, but work in progress, is that tracing is being implemented, with telecoms cooperating in giving mobile data to understand the evolution and geographical nodes of the disease. But data are only provided at some aggregate picture as to how the outbreak is developing. Using data, it seems, to act upon individuals, and their social ties, is not used at scale to date.
Figure 1: Preparedness to fight the COVID-19 disease
Other improvements should include:
-
Belgium is in short supply of protection equipment (masks, gloves, etc), as well as respirators.
-
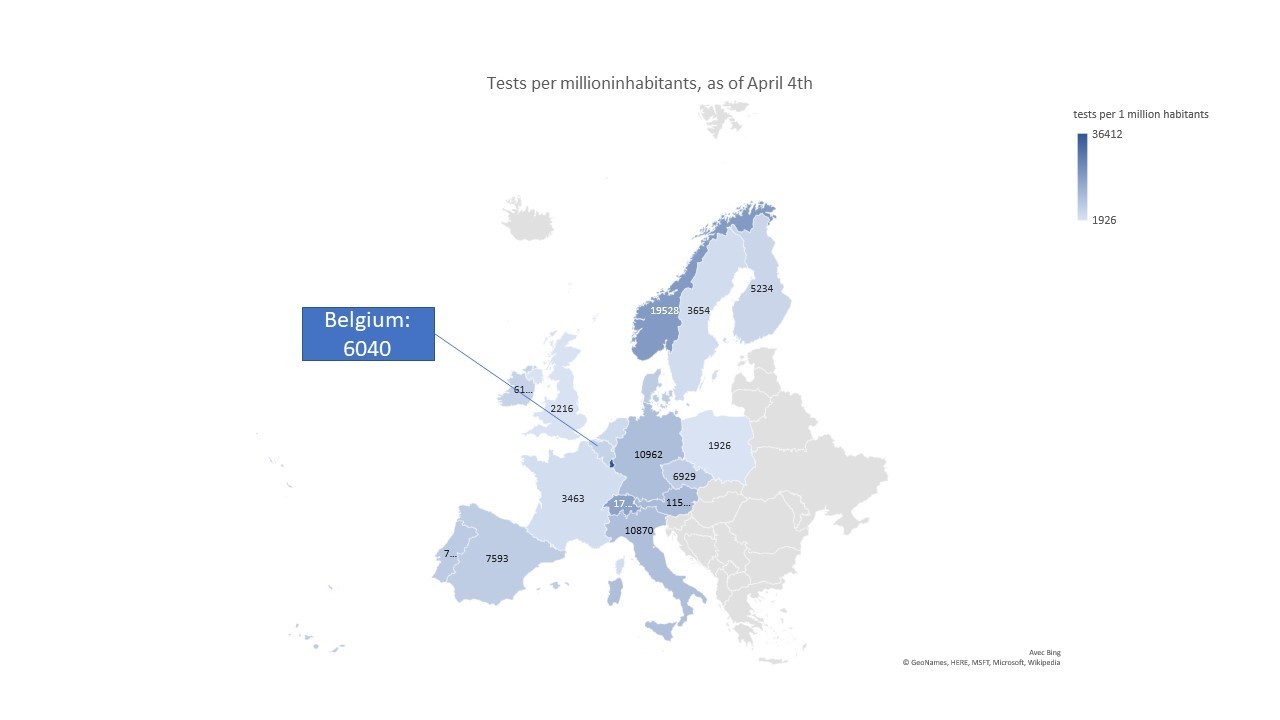
Belgium also has had limited ability to test, and about 4/1,000 citizens were tested by end of March, far below other countries in Europe, such as Switzerland, Germany and Austria , or indeed the Asian countries such as Singapore or South Korea. Belgium is however building up capacity to handle up to 10,000 tests a day, and is intending to move up to 50,000 a day.
Figure 2: How testing fares in Europe, April 4, 2020
- Finally, Belgian citizens have been applying, yet not perfectly, the rules of confinement. It is said that for instance, about 70% of people are working from home, travel outside home has been reduced by about 30% in a radius of 5 kms, among others.2
Taking all this together, Belgium looks a typical case of an European country, caught in the storm of the COVID-19 virus outbreak, but with both supply chain issues (medical and protective equipment, test availability), as well as with issues of citizen compliance to containment. Versus our key messages, Belgium has reacted early, and is working on both supply and citizens issues, even if with delay, and incompleteness. But still, it has limited knowledge of actual infection intensity, and a fortiori has yet to implement a model of spotting the infected, and of tracing social ties. Finally, and like other countries, it is still left in the dark regarding major behaviours of the virus.
Hence, if as a result of containment and fast actions, we might anticipate Belgium to start to “see some light at the end of the tunnel”. This hope is likely very sensitive to a few fundamental unknowns and social interactions drivers, as we show here-after.
4. Simulation results of Belgian outbreak developments
First, a word of caution- a lot of data are unknown. We thus want to make sure the reader takes the simulation result as first-order approximation only. Nevertheless, we believe the results are sufficiently illustrative to back up a few important messages going forward.
For our simulation we especially wish to understand the dynamics of development of COVID-19 fatalities in Belgium, from late March to beginning of May. The underlying development is linked to a reproduction rate, \(R_t\), with the following time dynamics:
where: \(t\) is a time period, \(R_0\) is the reproduction rate of the COVID-19; \(0 < r < 1 \) is the portion of recorded infected cases; \(0 < sr_t < 1\) is the share of reduction in contagious social contacts, \(\frac{I_t}{N_t}\) is the ratio of infected cases, \(I\) in total population, \(N\), and \(er>0\) is a factor of risk aversion that leads to a reduction in \(R_t\) the larger \(er\) as a symptom that population self protects better. \(0 < b < 1\) is the ratio of contamination of non recorded cases. We may have that \(e\) is different from \(er\) as well as \(s\) is different from \(sr\); as we do not have data on this, hence we assume simply that \(e=er\) and \(s=sr\), going forward. \(\frac{d(1-r_t)}{dt}<0\) if \(b<1\), and especially if Belgium increases its level of testing beyond people showing up at hospitals. We assume that tests will increase by 10,000 a day for the next ten days, and up to 25,000 afterwards.
For the simulation, we freeze \(R_0\) at about 2.3, in line with consensus and with my previous articles. Regarding \(b<1\), \(b\) is linked to milder cases or asymptomatic cases, as they tend to be not recorded. Those cases have been seen to be less contagious than others, and various studies suggest that \(b\) might be in the range of 0.4-0.5.3
The variable \((1-s)\) depends on extent of social distancing measures, and how people respect them. For Belgium, it is likely to be in the range of 0.5 by now. Typically, 40% of contacts are driven by schools and work and 35% by social community contacts, and the balance, by households. Schools in Belgium have been stopped at 90%, work is being stopped by 70% of individuals, and social contacts seem to be reduced by 35%. This leads to \(s\) being close to about 0.6, before adjustment for the social power of contacts. As remaining work contacts tend to be in more front line jobs (2 times more contacts), or social contacts are less respected by younger individuals (50% more contacts than average), we might expect \((1-s)=0.5\) for Belgium by now, or half the full potential. Note as well that at this level of \(s\), more than 50% is coming from both school closure and work, and thus this containment is very costly to society.
Finally, \(r\) is not constant and was likely very large at the start of the pandemic (as infection was incubated for a while, no tests were set up, etc). We calibrate the base case at 100,000 cases by April 1, versus a record of about 13,500 cases (of which roughly 4,500 cases from direct tests). This means that a ratio of non recorded to recorded cases was 7.4 by April 1. This is consistent with other figures we have estimated and reported elsewhere in previous articles, and in line with Li, et al. (see footnote 3). We nevertheless present the results for total infected cases at 50,000 (3.7 times recorded cases), as well for recorded cases plus tests as a last alternative (1.7 recorded cases outside tests), by April 1.
Our simulation is based on the following sensitivities. \(C\) is contamination power of unrecorded case, versus recorded case, or \(b\), and we assume \(b=0.2\) (\(L\) for low case); \(b=0.4\) (\(M\) for medium case) and \(b=0.6\) (\(H\) for high case). \(S\) is social contact, or \((1-s)\); and we assume \(s=0.8\), achieving low social contacts (\(LS\)), \(s=0.4\) (High social contact remaining). Finally, we look at risk aversion, \(es=e\). Low aversion is estimated at \(e=20\), High risk aversion is given by \(e=100\).
Those figures are also aligned with calibration to Chinese data regarding how people adapted their behavior following the development of the COVID-19.
Given the above, our results should lead to a less severe impact of COVID-19 at High risk aversion (\(HR\)), at low social contacts (\(LS\)), and at low contagious power of unrecorded cases (\(LC\)), - thus in the generic case of \(LC, LS, HR\). This is what we find in Figure 3, among the 12 possible combinations.
5. The importance of redefining social interaction and know the enemy
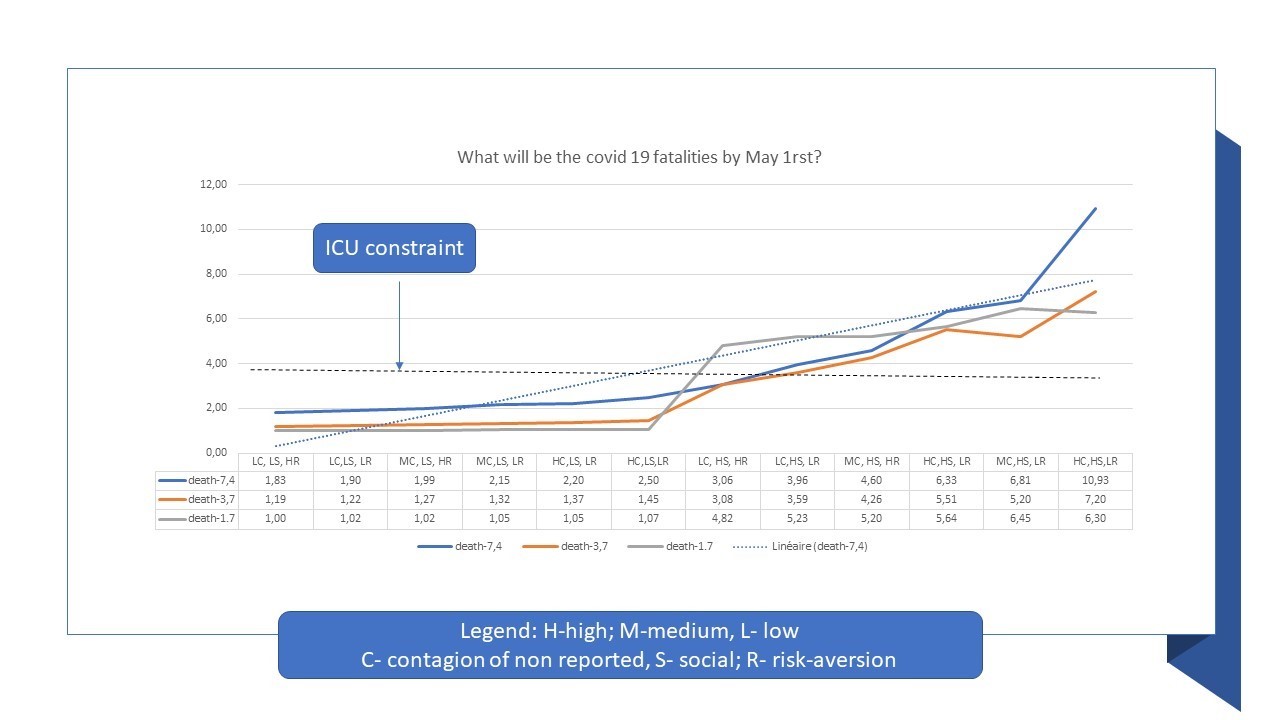
The Figure 3 presents the results, in terms of fatalities, assuming current fatalities of recorded cases, and a fatalities cut at 1/5 for those unrecorded. This assumption does indeed change the final figures, but not our message. Finally, we draw the implied capacity of ICU beds in “fatality equivalent”. The following insights emerge, for May 1:
-
As far as we are able to remain at \(LS\), (that is 80% reduction via social distancing), the number of fatalities remain below ICU bed capacity. Such a high level of social interaction decline versus today is not possible for everyone in long term of course. It must be tailored to the infected cases and their social ties to be sustainable.
-
If unrecorded cases build up, and a fortiori are more contagious, the higher the number of deaths, - that is, at \(LS\), the number of deaths go to close to double the number of recorded cases, and even 2.5 times at \(HC\).
-
When social contacts are not reduced by at least 50%, (\(HS\) means contact reduction at 40%), Belgium will face ICU constraints, even if risk aversion leads to high protective measures (e.g. even for scenarios with \(HR\)). This gives a clear insight that individual protections are important, but this re-emphasises point 1, that we must learn to live with a new form of social contact interaction.
-
If all changes are weak (social distancing is minimal, risk aversion is low, and contamination of unnoticed cases is large), then we have a real pandemic boost, up to 10 times the best case. This again implies we must work on ALL levers to hope to control the COVID-19 pandemic.
-
At intermediate cases, the number of non recorded cases may be large enough to boost a natural immune effect (number of death lower than in the cases of recorded cases, as large number of cases build up a natural immune barrier). However, at those intermediate cases, ICU bed capacity is too low to care about severe infections at hospitals, building a health crisis. Further, for countries with low self- control, the risk of death build ups more quickly. In other words, Japan may do it, but likely not the Us and Europe.
Figure 3: How the pandemic will play out - a view by May 1 in Belgium
6. Epilogue: Where might Belgium be on the outbreak by May 1?
Everything being equal, we might be today on the Orange or more likely on the Blue curve. We might be at just the cut-off of \(s>50%\), and self protection is likely in the low range, given limited masks in the public, etc. With those figures, Belgium may see a peak in number of “recorded” cases by mid April, and possibly a toll of about 1,600 to 2,500 fatalities, depending on different hypotheses.
The real danger is when \(s<40%\). There, the peak will not happen before May 1 - if any, and deaths will keep mounting, especially if number of non recorded cases are large, and (a bit) contagious.
Otherwise stated, the simulation is very clear that where Belgium will be by May 1, will depend on ways to sustain a model of social contacts that is likely halved for the average individual. This is likely not viable for many economically valuable segments (eg worker with kids), and thus we might need to find a model of selectivity, rather than reach, to amend social contacts. As said, a more promising one is one that allows to spot the infected to be quarantined. This means we must test, and protect more, and we must really understand all elements of unknowns linked to the pandemic of COVID-19.
A last and crucial word; we must manage our social contacts because we may make the healthcare system be overwhelmed. This challenge is even more acute for countries with less than 10 ICU beds per 100,000 inhabitants (and they are many). With the healthcare system, the number of contagious contacts is not to be reduced extensively given health workers must save life; we thus have to protect them heavily. There, it is a priority from the government to put all levers so that all clinical equipments and tests are made available as soon as yesterday, so as to make those workers work safe - and for our life.
© Jacques Bughin. Written April 4 and 5. Comments more than welcome. All errors are mine. References listed as they are found in the text
-
See The Western world should urgently play the “Asian smart” route to control the COVID-19 ↩
-
See Enquête de l’Université d’Anvers: “Les séniors suivent mieux que les jeunes les conseils de prévention”, and Selon une analyse des données télécoms, les Belges adaptent leur comportement après un petit délai ↩
-
See Li, et al. 2020, Substantial undocumented infection facilitates the rapod dissemination of novel coronavirus, Science. ↩