After the great lockdown: five uncomfortable truths to work out
-
-
-
-
J.Bughin
After the great lockdown: five uncomfortable truths to work out
May 24. Since its recognition as a human disease by mid January 2020, the Covid-19 has infected five million people, and killed more than 300,000 worldwide according to the official statistics.
Along the way, major lockdown has been put in place in more than 40% of countries, accounting for nearly 80% of the world population (Lipton and Prado, 2020). While this has brought a major drop in economic activity, which may lead to a global GDP shrinking by 3% this year, according to last estimates by the IMF,1 the pandemic is now getting in some form of control five months later, with health systems able to breathe. The narrative around ther Covid-19 has evolved drastically across time. It was first “a bug that has no evidence to spread to humans” and “it is like another flu”, to, “the Covid-19 pandemic is real”; “social shutdown is the only way to flatten the curve of diffusion of the disease”, and now: “we have managed it, it is time to exit and to look forward”.
Figure 1: Country examples of Covid-19 peak time
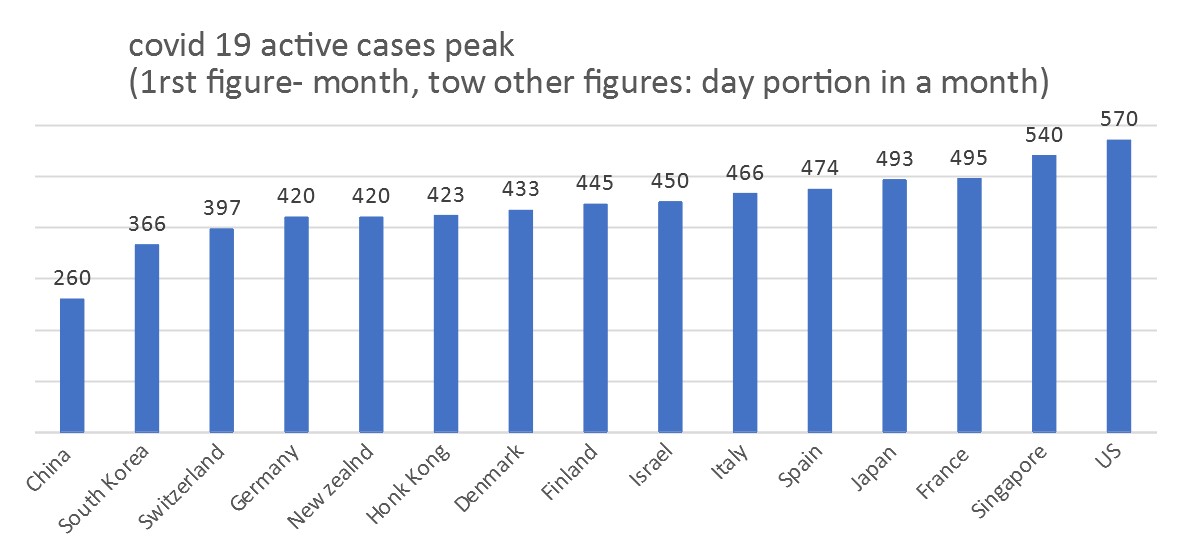
While most of us have possibly followed the same cycle of narrative, from « this is nothing, to this is very scary, and we are now relieved », the evidence is indeed that wave 1 outbreak is getting under control, witth many but not all, countries having active cases peak (as early as Feb 17 for China, but just before May for Japan in Asia; in the second end of April for Europe, with Switzerland and Germany just ahead by early April, and May 21 for the US, see Figure 1).
But going back to the “new” normal is laudable, but must also keep a close management eye on both the disease evolution, as well as on the socio-economic burden that has come along the Covid-19 crisis. Here are five uncomfotable truths to cope.
1. We must get ready for a second wave
The odds of having a second wave are high. This is what we may learn from the past influenza-like pandemics, and what we might infer from the “official statistics” regarding the Covid-19 infection rate to date, - as the total infected are far away from the threshold of herd immunity that allows to control the disease.
But what else can we derive from the past experience of pandemics, and from own simulation post pandemic?
The past has shown that:
-
The pandemic often come back rather soon as wave 2, in the four to 8 months of the first. This means we may be hit still this year by the second wave.
-
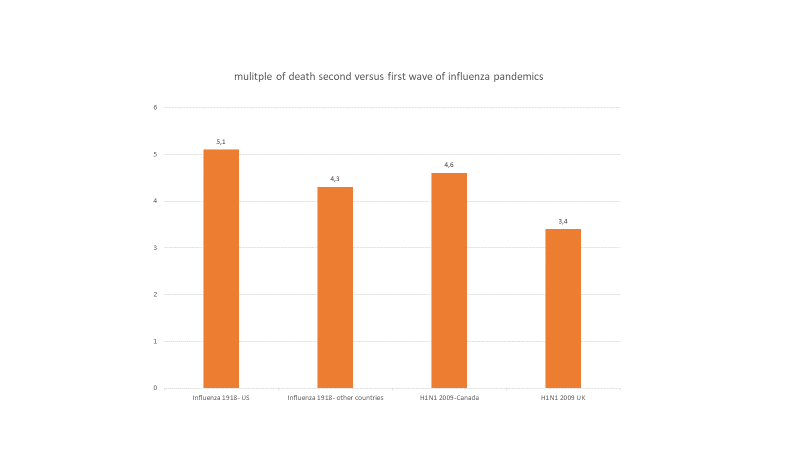
The second wave can even be more lethal - for example, in the second wave of the 2009 H1N1, some countries like Canada, got hit… 5 times more - and the second wave in 1918 of the Spanish influenza seems to have killed at a multiplier the same size as the one found in Canada during the 2009 health crisis, see Figure 2.
Figure 2- Wave 2 can be dangerous
Simulation is also useful to see what might happen if social distancing is no longer imposed but made directly by citizens at 50% of the success of the lockdown and if the Covid-19 behaves under some extremes, such as the common cold (HCov-0C43, mild disease but seasonal and fast decay of immunity, disappearing in 4 to 6 months), or the SarS-Cov-1(more lethal, but with longer immunity, in the range of 1.5 to 3 years), and if we believe or not that cross-immunity within the family of coronaviruses might work.
Using parameters in the literature, such as seasonality that implies a peak - through of 20% gap for the reproduction rate, or cross-immunity between viruses of about 30% (see Kissler et al., 2020), the messages are clear that:
-
Wave 2 is always capable of happening, whatever assumptions taken
-
Short immunity (like the common cold) and limited cross-immunity leads to faster as well as larger occurrence than vice-versa—and possibly, or a size higher than wave
-
Social distancing, if too stringent, may however lead to a strong wave 2, as no built immunity is deployed, but we better need at least 50% reduction of contacts of effective lockdown to control the disease
The past as well as scenarios fine tuned to the socio-epidemiology of the Covid-19 and its coronavirus family leads to the uncomfortable truth that « one battle was won, not the war ». And the next battle may come soon and be big(ger than what we just won).
2. We may not be taken off-guard by being fooled by the wrong figures
It has been said multiple times that we are « flying blind, regarding key figures on the pandemic ». The current official figures suggest a rather low infection rate for a virus with such a difficult profile of latency and symptoms, and a high fatality burden.
We do not suggest that reported cases are intentionally under-reported. Those figures may be adequate if they only cover the people with severe symptoms, requiring hospitalization, and where systematic testing was made. The danger of not having a comprehensive view on figures is however many. The first is that we may forget other channels - the typical example has been not to look at home care, which happened to be a major source of deaths, - see my other article
The second risk is that the fatality rate at time of hospitalization is moving from virtually zero to 20%, at time of hospitalization, and possibly at 50% when someone is at ICU. Those stats are not good, as it may look like the odds of dying become as large as flipping a dice. This means we must look before hospitalization, when people critiically upgrade from death free to death liable. But without statistics, it is very difficult to prevent.
The third risk is that we may be put off-guard as to the timing of the wave 2. We have collected many statistics and run maximum likelihood models to find most probable estimates of infection, see among others my previous post.
Many new studies also reveal that the recorded cases may be off by a factor of up to 5-10. For example, one recent study done in France suggests that hospitalization is only 3.6% of total infected, or a ratio of 28, while the 85/15 rule (85% mild cases, 15% severe cases for covid-19), rather implies a ratio of 5, leading to an understatement of actual infection by 5-fold (Salje et al., 2020). The implication of such a gap is that fatality rates are clearly overstated, but also that people can be more often faced with getting the disease than said. At current transmission rate, and given that, despite a 5 to 10 fold adjustment, most countries are far off the herd immunity portion of infection, a higher contaminated stock means that the infection flow is larger per day, as the infection figure builds up like a power law. We might thus take high risk for wave 2, as bed capacity are fixed, or at best can be increased, but usually only linearly.
3. Health risk may only start for the recovered from the Covid-19
At current, a large focus has been on serious cases and fatalities in the Covid-19 crisis. The typical assumption is that recovered people are all « fit and proper ». But remember, that, for 1 death at hospital, 5 others survive—and possibly, for one person requiring hopsitalisation, possibly 5 times more officially, and possibly 25 - 50 times more did recover outside the hospital channels.
What if this massive number of people, - between 5 to 40 million people worldwide, recovery is not complete?
Those risks are not nil, as acknolwedged by Kelly Servick, a writer for Science, in an April piece entitled «For survivors of severe COVID-19, beating the virus is just the beginning». In fact, the history provides some clear evidence of short and long-term damages.
Regarding short-term damages, more than one third of people who got hospitalized for the 2003 SARS outbreak felt anxiety and depression disorders, still one year after the infection (Lee et al, 2007). Likewise, if pneumony is a marker for Covid-19, there is four times more probability to suffer a cardiovascular disease, for those getting hospitalized for acute pneumonia than not.
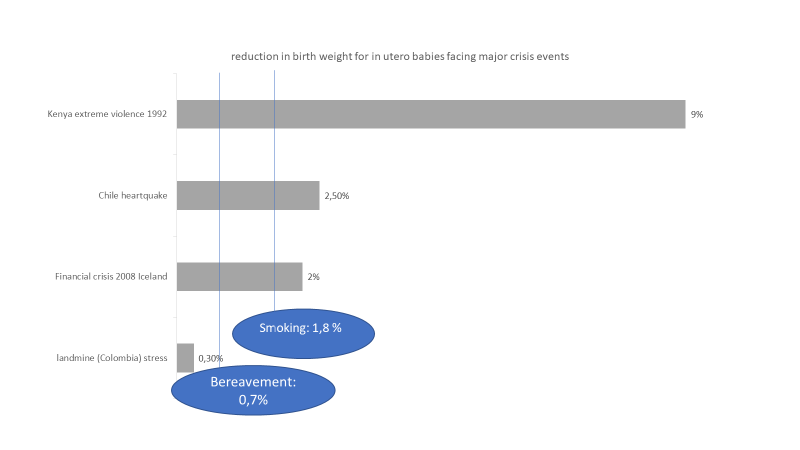
But those are only short-term effect; long term effects may be present too. In fact, multiple studies looking at in utero reaction of to be born kids from parents caught into the 1918 pandemics suggests large morbidity effects still 25 to 40 years after, affecting lung, kidney, and many other organs, with impact on productive and social life (Almond, 2005 and 2006). Compiling a series of in utero studies, the effects may be important, impacting the next generation, in a ratio of 1 to 9% of weight of new borns, see Figure 3.
Figure 3 - how adverse shocks may affect the long-term - in utero effects
4. We must be bold enough to relaunch inclusive economies
The burden is not only about health, it is socio-economic. Short-term costs linked to lockdown are not small, with eg in the US, average income and wealth lost estimated to be more than 5,000 US Dollars and 33,000 dollars respectively (Coibion et al, 2020).
If total burden may come to 5-10% of welfare lost, it is already clear that a « V » recovery may be rather optimistic. A « U » shape may be a better representation, as seen from the early data of China, where economic recovery has been slow pace.
A « L » shape is possibly not to be neglected, both because of the risk of Wave 2 still this year, and because crises of that size may lead to major distorsions, affecting investments and ultimately growth path in the future. Plans have been announced by a large set of countries to stimulate growth, and prevent the worst case of a « L- like » recovery. The key question remaining is: do they spend (fast) enough and inclusively?
To date, most countries have put a fiscal stimulus in the range of 2% of GDP, on top of facilities of re-payment. The later is de facto crucial as the OECD, leveraging Orbis data, finds that 1/3 of firms may run out of liquidity after after three months of lockdown. This liquidity crunch is thus massive and must be sorted out clearly (OECD, 2020). Regarding the former, the size of the stimulus might appear not bold enough.
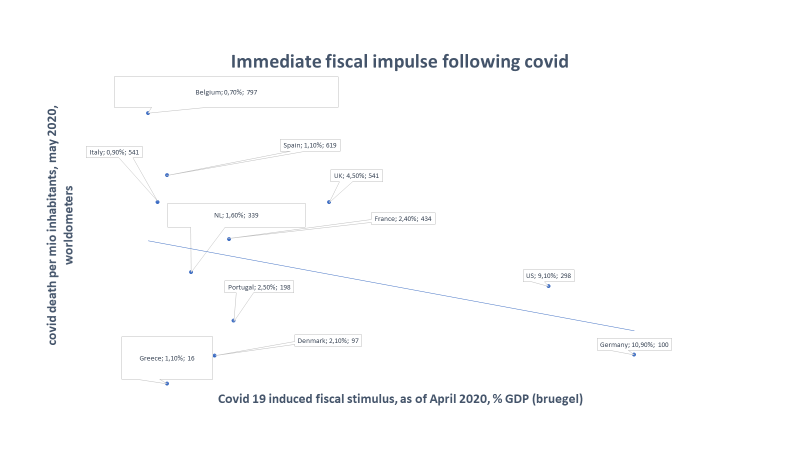
Consider that the spent figure is higher than during the crisis 2008 (eg., G-20 spent roughly 1.4% of GDP in stimulus package), and at that time too US spent significantly more (like China) to reboost the economy. Today, we see the same pattern, with US, but this time Germany, spending close to 10% of their GDP (data courtesy of Bruegel, see Figure 4) for their stimulus package. Yet, there remain some clear surprises:
-
Why is it that countries with more covid damages seem to commit less amount of stimulus than others?
-
Why is the level of fiscal spent not bigger than the 2008 crisis, while the GDP shortfall of the pandemic may oscillate between -2 to -8% percent for 2020 alone in developed countries, that is, an effect that is larger than witnessed during the 2008 crisis? In fact, if consumption and private investment is 70% of GDP, the (undiscounted) multiplier effect from year 1 to 5 after the spent of 2%, would be 3.6%, with recovery of spent by 2022, and for a total of 5.6%, of just the mid range of risk of output contraction for Covid-19.
The EU Recovery plan proposed by the Franco-German team of a €500 billion of spending that has been recently backed by the EU budget a few days ago is a path to boldness and would represent an European-wide fiscal policy, that could be jointly spent on key forward looking infrastructure in sustainability theme, new investment in frontier technologies, among others.
Figure 4 - Immediate fiscal impulse commitment for Covid-19 risk
Finally, the question is not that we spend enough to restore - the question is whether we remain inclusive. There is clear evidence that the ethnic and socio-economic distribution of health impact of the Covid-19 is not favorable to lower socio-economic group and minorities. Eg lower socio-economic groups suffer more often from comorbidities and are thus more at risk of fatality from the disease; likewise those groups are more at risk of unemployment.
Or, if employed, they are more at risk of exposure with lower probabilities of remote working among others. Increase in inequality from the Covid-19 must be part of next agenda, as it ultimately would weight on prospect of recovery and growth.
5. We must secure democracy
Last but not least, it will be critical to fix the impact of the Covid-19, on the role of the the State, the dynamics of election, and public economy at large.
Many states have voted for exceptional power, in the first place to take measures linked to confinement. But it may remain crucial to consider those powers are temporary, as part of this exception — not as a new rule. Some governements are already tempted to take advantage of extra power given by the Covid-19.
More subtle is the issue of election. France is going for a second round of vote for municipalities, at “Covid-19 time, that may undermine the representation of election, for example. A recent study conducted in the US identified that counties that voted after Super Tuesday and which were then exposed to Covid-19 outbreak, were less likely to support Sanders , leading to 4 percentage points less support compared to Sanders 2016 vote (Bisbee and Honing, 2020). This effect is material and may mean election may be greatly influenced by the hazard of a pandemic wave like Covid-19. We may extrapolate this argument for the US presidency election, a fortiori if a new wave (is likely to) break around that voting time.
References
-
Almond, D. (2006). Is the 1918 influenza pandemic over? Long-term effects of in utero influenza exposure in the post-1940 US population. Journal of political Economy, 114(4), 672-712.
-
Almond, D., & Mazumder, B. (2005). The 1918 influenza pandemic and subsequent health outcomes: an analysis of SIPP data. American Economic Review, 95(2), 258-
-
Bisbee, J and D. Honig, (2020), Flight to safety: 2020 Democratic primary election results and Covid, Covid Economics, Vetted and Real time papers, 19
-
Coibion, O. , Y. Gorodnichenko and M. Weber ( 2020), The costs of covid 19 crisis- lockdowns, macro-expectations and consumer spending, Covid Economics, vetted and real time papers.
-
Helferty, M., Vachon, J., Tarasuk, J., Rodin, R., Spika, J., & Pelletier, L. (2010). Incidence of hospital admissions and severe outcomes during the first and second waves of pandemic (H1N1) 2009. Cmaj, 182(18), 1981-1987.
-
Kissler, S. M., Tedijanto, C., Goldstein, E., Grad, Y. H., & Lipsitch, M. (2020). Projecting the transmission dynamics of SARS-CoV-2 through the postpandemic period. Science.
-
Lee AM, Wong JG, McAlonan GM, et al. Stress and psychological distress among SARS survivors 1 year after the outbreak. Can J Psychiatry. 2007;52(4):233‐240.
-
Lipton, Alex, and Marcos Lopez de Prado. “Exit Strategies for COVID-19: An Application of the K-SEIR Model (Presentation Slides).” Available at SSRN 3579712 (2020).
-
Mummert, A., Weiss, H., Long, L.P., Amigó, J.M. and Wan, X.F., 2013. A perspective on multiple waves of influenza pandemics. PloS one, 8(4).
-
OECD (2020a), “Corporate sector vulnerabilities during the Covid-19 outbreak: assessment and policy responses”, Tackling Coronavirus Series
-
Taubenberger, Jeffery K., and David M. Morens. “1918 Influenza: the mother of all pandemics.” Revista Biomedica 17, no. 1 (2006): 69-79.
© Jacques Bughin, all errors remain mine